Benton County, Iowa Nativity & Citizenship Status (2024)
Place of birth and citizenship status analysis for Benton County, Iowa
Benton County, Iowa Nativity & Citizenship Indicators (2024)
Native Born
99.2%
Foreign Born
0.8%
Naturalized
0.6%
US Citizens
99.7%
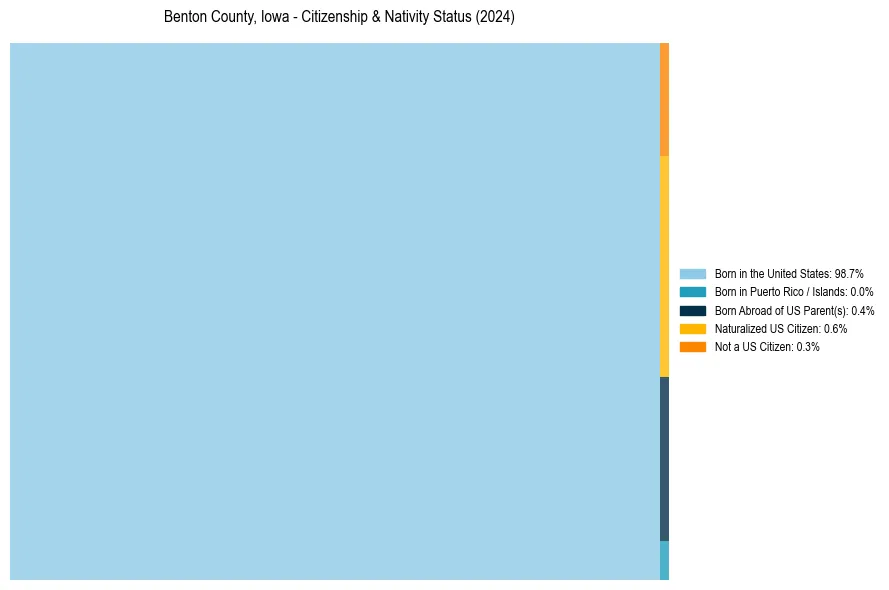
Benton County, Iowa Nativity & Citizenship Distribution
Benton County, Iowa Historical Nativity Trends (2010–2024)
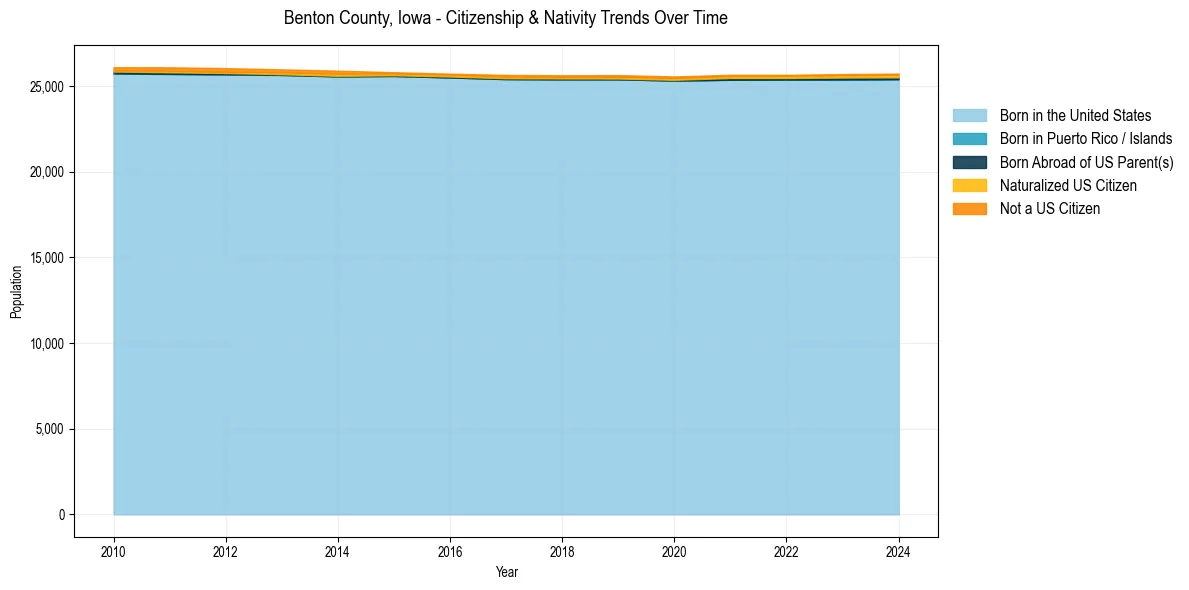
Benton County, Iowa Population & Nativity History
| Year | Total Pop | Foreign Born | Native Born |
|---|---|---|---|
| 2024 | 25,724 | 0.8% | 99.2% |
| 2023 | 25,698 | 0.8% | 99.2% |
| 2022 | 25,652 | 0.7% | 99.3% |
| 2021 | 25,654 | 0.7% | 99.3% |
| 2020 | 25,558 | 0.8% | 99.2% |
| 2019 | 25,636 | 0.8% | 99.2% |
| 2018 | 25,626 | 0.7% | 99.3% |
| 2017 | 25,646 | 0.8% | 99.2% |
| 2016 | 25,720 | 0.6% | 99.4% |
| 2015 | 25,803 | 0.7% | 99.3% |
| 2014 | 25,895 | 1.2% | 98.8% |
| 2013 | 25,971 | 1.1% | 98.9% |
| 2012 | 26,044 | 1.1% | 98.9% |
| 2011 | 26,089 | 1.1% | 98.9% |
| 2010 | 26,098 | 1.0% | 99.0% |
Nativity & Citizenship FAQs for Benton County, Iowa
Approximately 0.8% of residents in Benton County, Iowa were born outside the United States.
The vast majority of residents, roughly 99.7%, are U.S. citizens (including both native-born and naturalized citizens).