Tippecanoe County, Indiana Nativity & Citizenship Status (2024)
Place of birth and citizenship status analysis for Tippecanoe County, Indiana
Tippecanoe County, Indiana Nativity & Citizenship Indicators (2024)
Native Born
87.7%
Foreign Born
12.3%
Naturalized
3.7%
US Citizens
91.4%
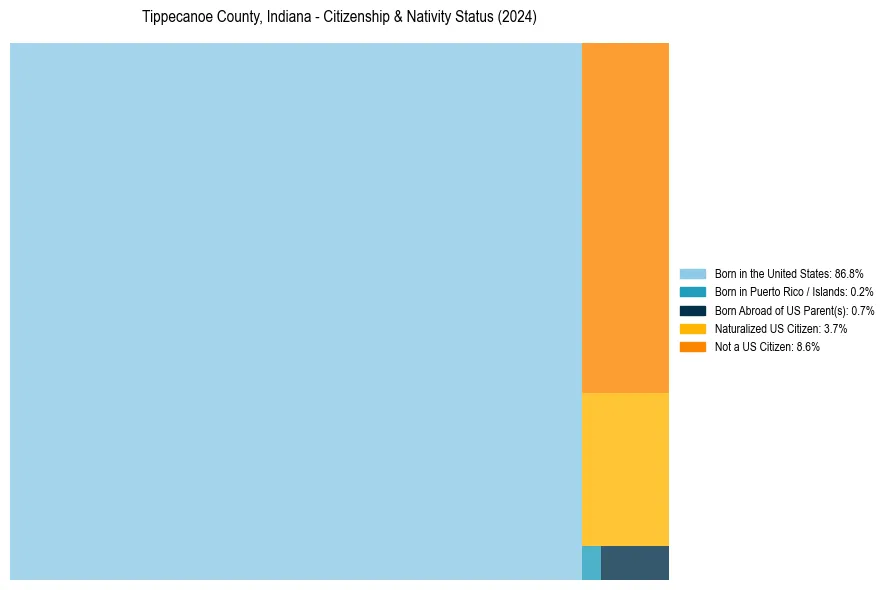
Tippecanoe County, Indiana Nativity & Citizenship Distribution
Tippecanoe County, Indiana Historical Nativity Trends (2010–2024)
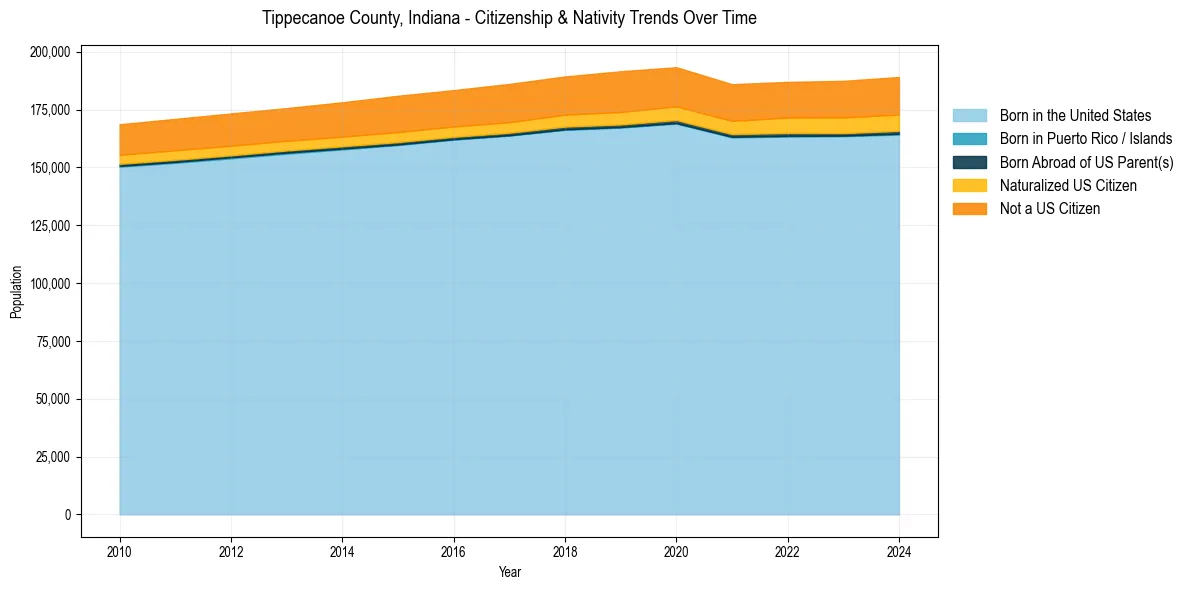
Tippecanoe County, Indiana Population & Nativity History
| Year | Total Pop | Foreign Born | Native Born |
|---|---|---|---|
| 2024 | 189,071 | 12.3% | 87.7% |
| 2023 | 187,399 | 12.1% | 87.9% |
| 2022 | 186,955 | 11.8% | 88.2% |
| 2021 | 185,961 | 11.6% | 88.4% |
| 2020 | 193,302 | 11.8% | 88.2% |
| 2019 | 191,553 | 12.0% | 88.0% |
| 2018 | 189,294 | 11.5% | 88.5% |
| 2017 | 186,081 | 11.3% | 88.7% |
| 2016 | 183,397 | 11.0% | 89.0% |
| 2015 | 180,952 | 11.1% | 88.9% |
| 2014 | 178,135 | 10.7% | 89.3% |
| 2013 | 175,628 | 10.4% | 89.6% |
| 2012 | 173,317 | 10.5% | 89.5% |
| 2011 | 170,965 | 10.3% | 89.7% |
| 2010 | 168,635 | 10.1% | 89.9% |
Nativity & Citizenship FAQs for Tippecanoe County, Indiana
Approximately 12.3% of residents in Tippecanoe County, Indiana were born outside the United States.
The vast majority of residents, roughly 91.4%, are U.S. citizens (including both native-born and naturalized citizens).