Hendricks County, Indiana Nativity & Citizenship Status (2024)
Place of birth and citizenship status analysis for Hendricks County, Indiana
Hendricks County, Indiana Nativity & Citizenship Indicators (2024)
Native Born
92.7%
Foreign Born
7.3%
Naturalized
4.2%
US Citizens
96.9%
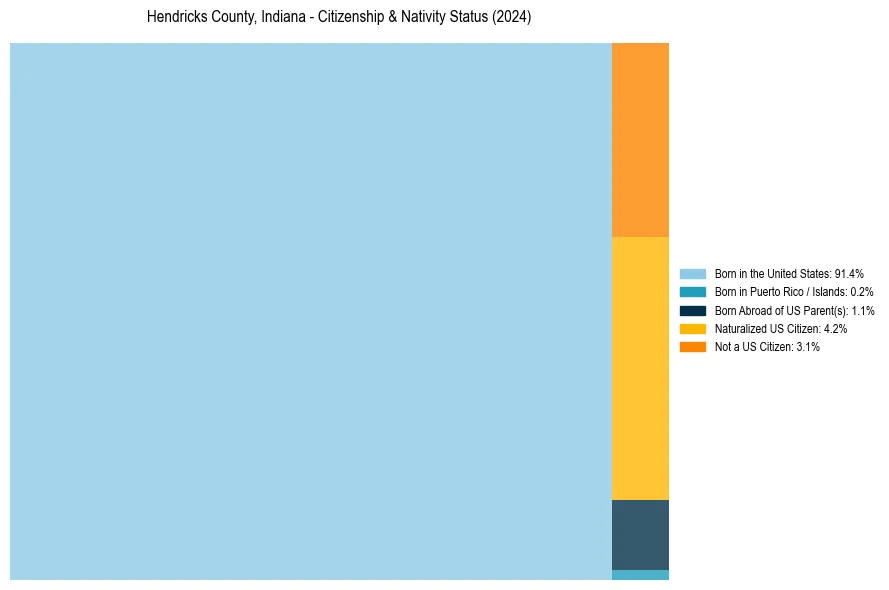
Hendricks County, Indiana Nativity & Citizenship Distribution
Hendricks County, Indiana Historical Nativity Trends (2010–2024)
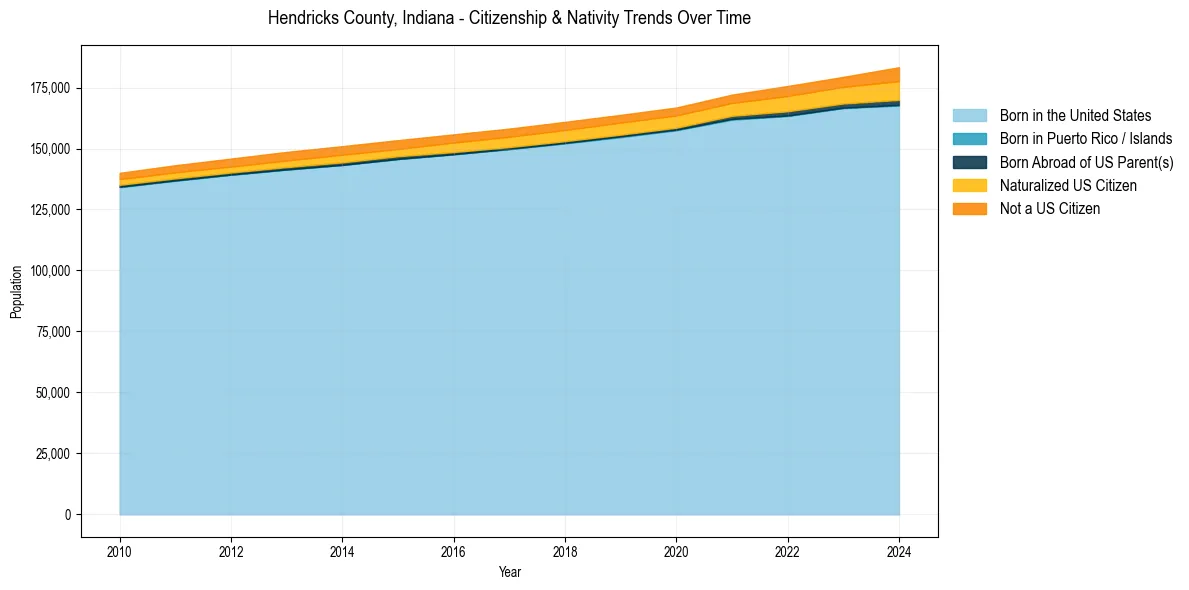
Hendricks County, Indiana Population & Nativity History
| Year | Total Pop | Foreign Born | Native Born |
|---|---|---|---|
| 2024 | 183,344 | 7.3% | 92.7% |
| 2023 | 179,379 | 6.1% | 93.9% |
| 2022 | 175,639 | 5.9% | 94.1% |
| 2021 | 172,100 | 5.1% | 94.9% |
| 2020 | 166,806 | 5.0% | 95.0% |
| 2019 | 163,799 | 5.0% | 95.0% |
| 2018 | 160,940 | 4.9% | 95.1% |
| 2017 | 158,170 | 4.8% | 95.2% |
| 2016 | 155,817 | 4.7% | 95.3% |
| 2015 | 153,435 | 4.3% | 95.7% |
| 2014 | 150,977 | 4.4% | 95.6% |
| 2013 | 148,623 | 4.2% | 95.8% |
| 2012 | 145,880 | 3.9% | 96.1% |
| 2011 | 143,153 | 3.8% | 96.2% |
| 2010 | 140,028 | 3.5% | 96.5% |
Nativity & Citizenship FAQs for Hendricks County, Indiana
Approximately 7.3% of residents in Hendricks County, Indiana were born outside the United States.
The vast majority of residents, roughly 96.9%, are U.S. citizens (including both native-born and naturalized citizens).