Clark County, Indiana Nativity & Citizenship Status (2024)
Place of birth and citizenship status analysis for Clark County, Indiana
Clark County, Indiana Nativity & Citizenship Indicators (2024)
Native Born
95.8%
Foreign Born
4.2%
Naturalized
1.6%
US Citizens
97.5%
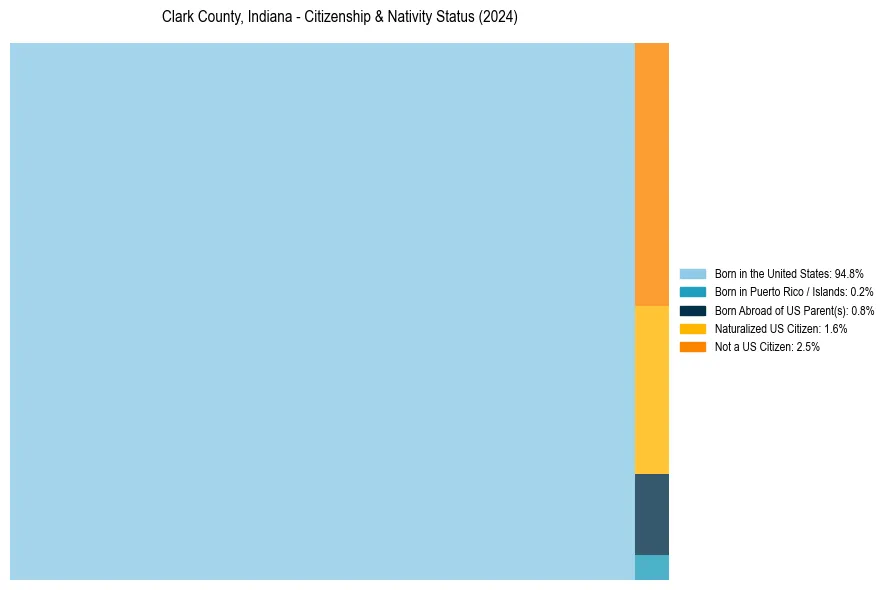
Clark County, Indiana Nativity & Citizenship Distribution
Clark County, Indiana Historical Nativity Trends (2010–2024)
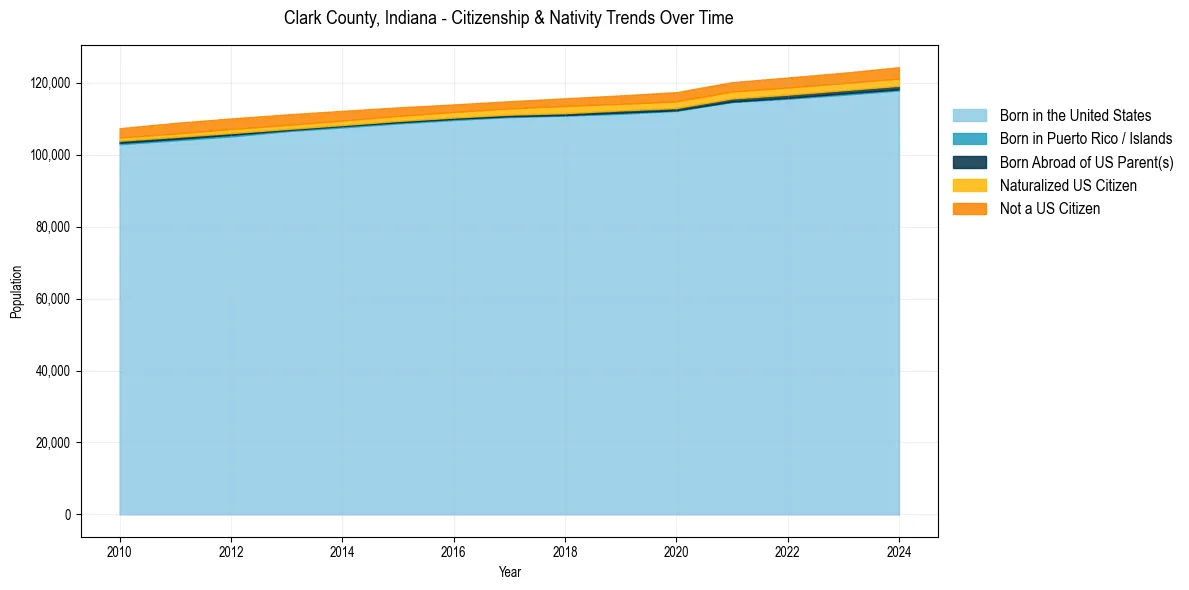
Clark County, Indiana Population & Nativity History
| Year | Total Pop | Foreign Born | Native Born |
|---|---|---|---|
| 2024 | 124,354 | 4.2% | 95.8% |
| 2023 | 122,800 | 4.0% | 96.0% |
| 2022 | 121,484 | 3.9% | 96.1% |
| 2021 | 120,185 | 3.8% | 96.2% |
| 2020 | 117,410 | 3.8% | 96.2% |
| 2019 | 116,507 | 3.6% | 96.4% |
| 2018 | 115,702 | 3.6% | 96.4% |
| 2017 | 114,893 | 3.3% | 96.7% |
| 2016 | 113,993 | 3.2% | 96.8% |
| 2015 | 113,181 | 3.3% | 96.7% |
| 2014 | 112,212 | 3.5% | 96.5% |
| 2013 | 111,221 | 3.7% | 96.3% |
| 2012 | 110,100 | 3.7% | 96.3% |
| 2011 | 108,864 | 3.6% | 96.4% |
| 2010 | 107,381 | 3.2% | 96.8% |
Nativity & Citizenship FAQs for Clark County, Indiana
Approximately 4.2% of residents in Clark County, Indiana were born outside the United States.
The vast majority of residents, roughly 97.5%, are U.S. citizens (including both native-born and naturalized citizens).