Winnebago County, Illinois Nativity & Citizenship Status (2024)
Place of birth and citizenship status analysis for Winnebago County, Illinois
Winnebago County, Illinois Nativity & Citizenship Indicators (2024)
Native Born
91.1%
Foreign Born
8.9%
Naturalized
4.3%
US Citizens
95.4%
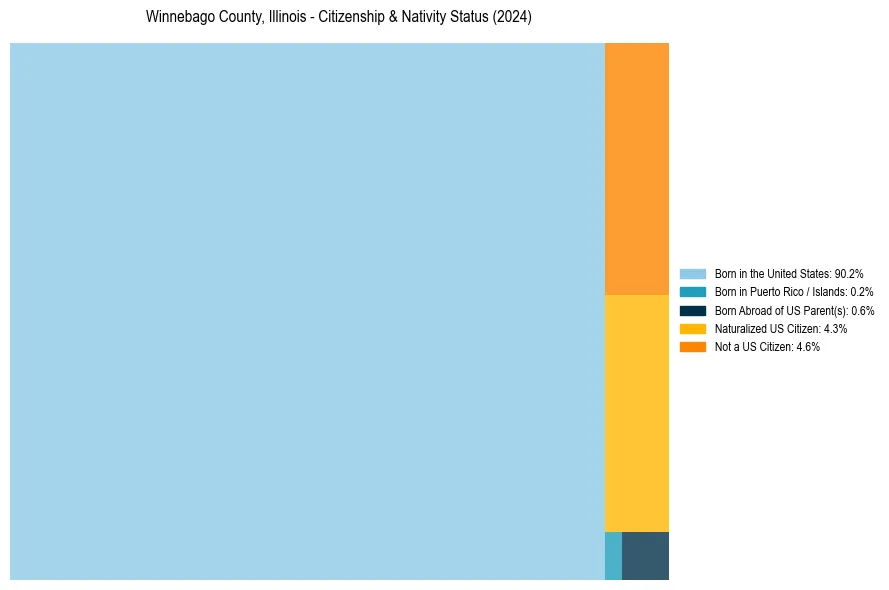
Winnebago County, Illinois Nativity & Citizenship Distribution
Winnebago County, Illinois Historical Nativity Trends (2010–2024)
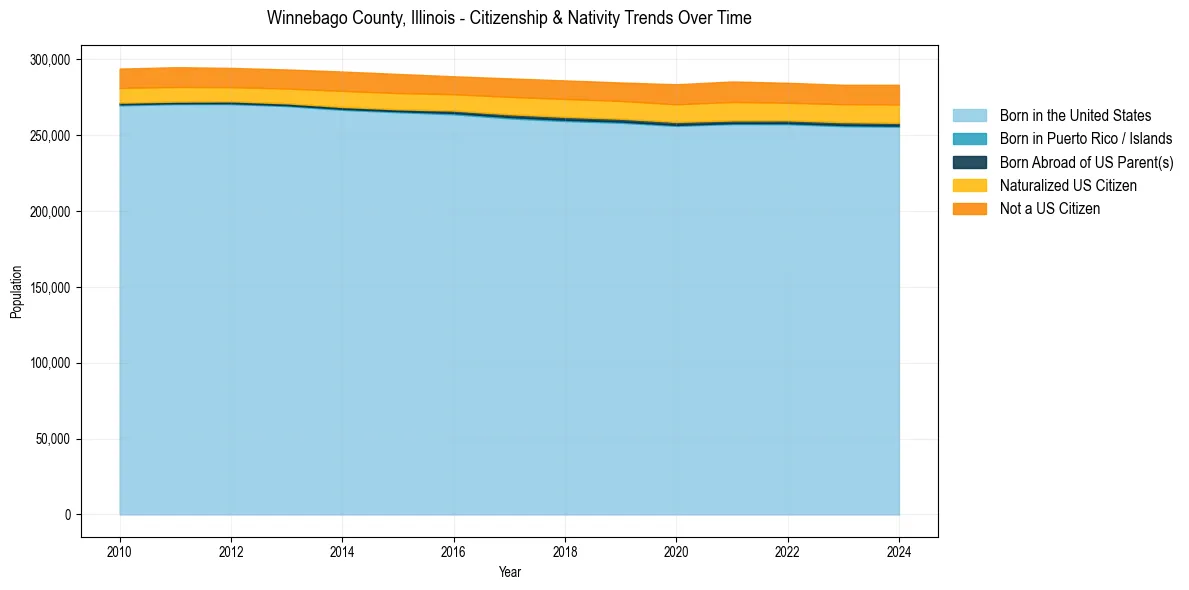
Winnebago County, Illinois Population & Nativity History
| Year | Total Pop | Foreign Born | Native Born |
|---|---|---|---|
| 2024 | 283,292 | 8.9% | 91.1% |
| 2023 | 283,289 | 8.7% | 91.3% |
| 2022 | 284,591 | 8.7% | 91.3% |
| 2021 | 285,471 | 9.0% | 91.0% |
| 2020 | 283,635 | 8.8% | 91.2% |
| 2019 | 284,819 | 8.4% | 91.6% |
| 2018 | 286,174 | 8.4% | 91.6% |
| 2017 | 287,512 | 8.2% | 91.8% |
| 2016 | 288,896 | 7.8% | 92.2% |
| 2015 | 290,439 | 8.0% | 92.0% |
| 2014 | 292,026 | 8.0% | 92.0% |
| 2013 | 293,384 | 7.6% | 92.4% |
| 2012 | 294,433 | 7.5% | 92.5% |
| 2011 | 294,893 | 7.7% | 92.3% |
| 2010 | 293,972 | 7.6% | 92.4% |
Nativity & Citizenship FAQs for Winnebago County, Illinois
Approximately 8.9% of residents in Winnebago County, Illinois were born outside the United States.
The vast majority of residents, roughly 95.4%, are U.S. citizens (including both native-born and naturalized citizens).