Vermilion County, Illinois Nativity & Citizenship Status (2024)
Place of birth and citizenship status analysis for Vermilion County, Illinois
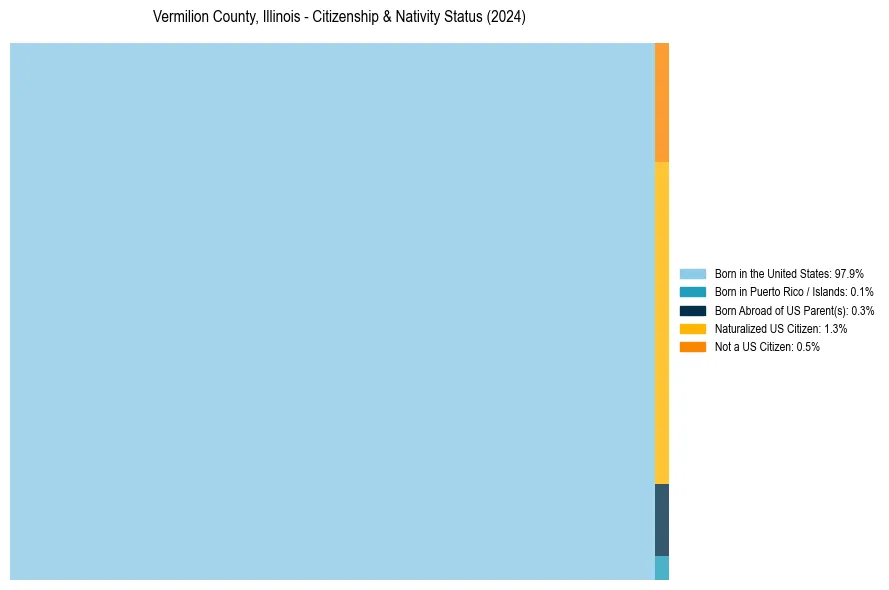
Vermilion County, Illinois Nativity & Citizenship Indicators (2024)
Native Born
98.2%
Foreign Born
1.8%
Naturalized
1.3%
US Citizens
99.5%
Vermilion County, Illinois Nativity & Citizenship Distribution
Vermilion County, Illinois Historical Nativity Trends (2010–2024)
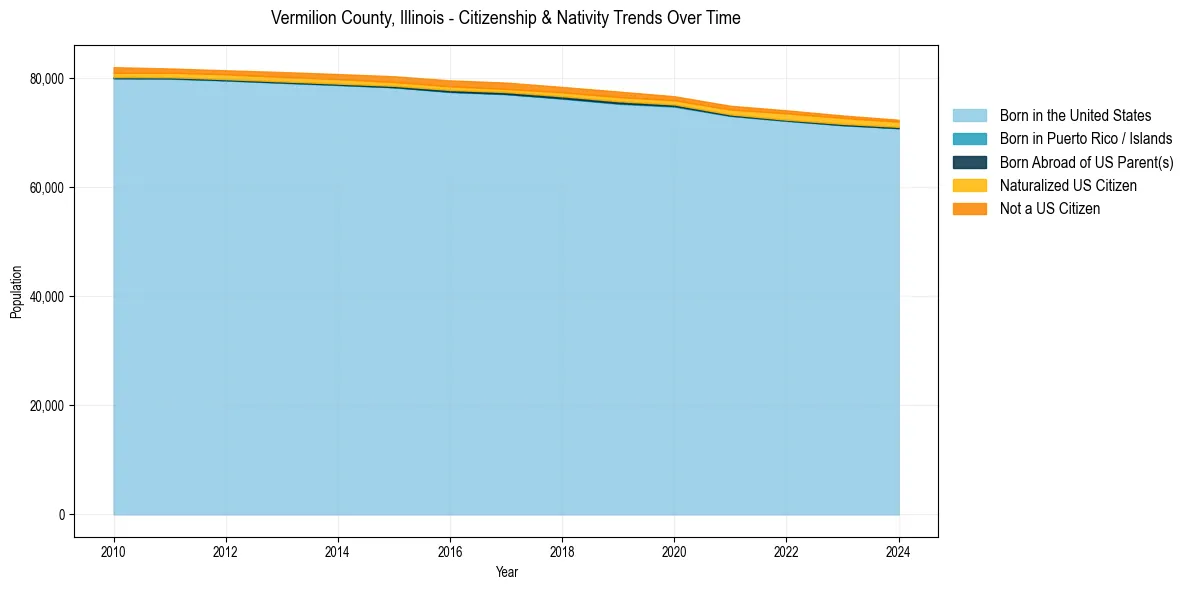
Vermilion County, Illinois Population & Nativity History
| Year | Total Pop | Foreign Born | Native Born |
|---|---|---|---|
| 2024 | 72,386 | 1.8% | 98.2% |
| 2023 | 73,179 | 2.1% | 97.9% |
| 2022 | 74,113 | 2.3% | 97.7% |
| 2021 | 74,953 | 2.1% | 97.9% |
| 2020 | 76,704 | 2.0% | 98.0% |
| 2019 | 77,563 | 2.3% | 97.7% |
| 2018 | 78,407 | 2.2% | 97.8% |
| 2017 | 79,207 | 2.2% | 97.8% |
| 2016 | 79,613 | 2.2% | 97.8% |
| 2015 | 80,368 | 2.2% | 97.8% |
| 2014 | 80,773 | 2.2% | 97.8% |
| 2013 | 81,147 | 2.1% | 97.9% |
| 2012 | 81,463 | 2.0% | 98.0% |
| 2011 | 81,799 | 2.0% | 98.0% |
| 2010 | 82,033 | 2.2% | 97.8% |
Nativity & Citizenship FAQs for Vermilion County, Illinois
Approximately 1.8% of residents in Vermilion County, Illinois were born outside the United States.
The vast majority of residents, roughly 99.5%, are U.S. citizens (including both native-born and naturalized citizens).