Tazewell County, Illinois Nativity & Citizenship Status (2024)
Place of birth and citizenship status analysis for Tazewell County, Illinois
Tazewell County, Illinois Nativity & Citizenship Indicators (2024)
Native Born
98.4%
Foreign Born
1.6%
Naturalized
1.0%
US Citizens
99.3%
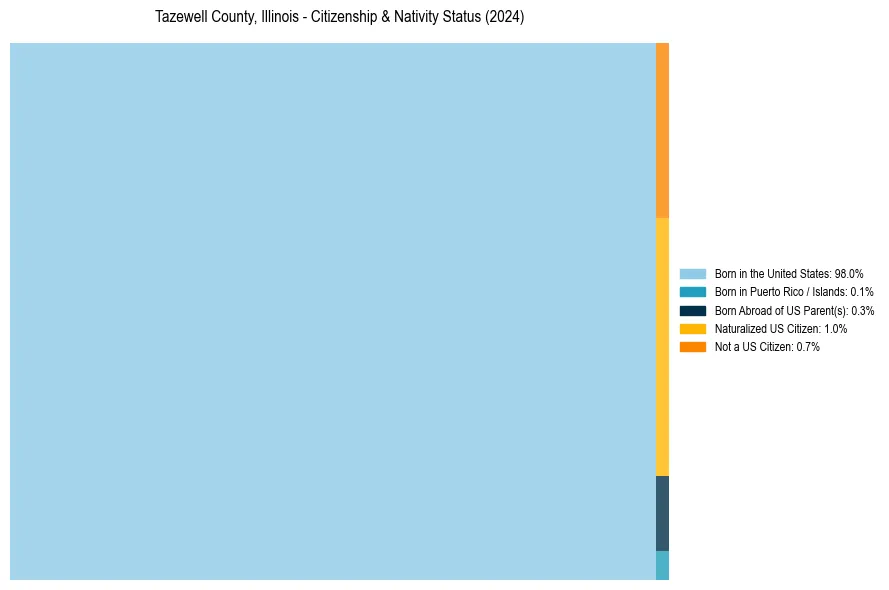
Tazewell County, Illinois Nativity & Citizenship Distribution
Tazewell County, Illinois Historical Nativity Trends (2010–2024)
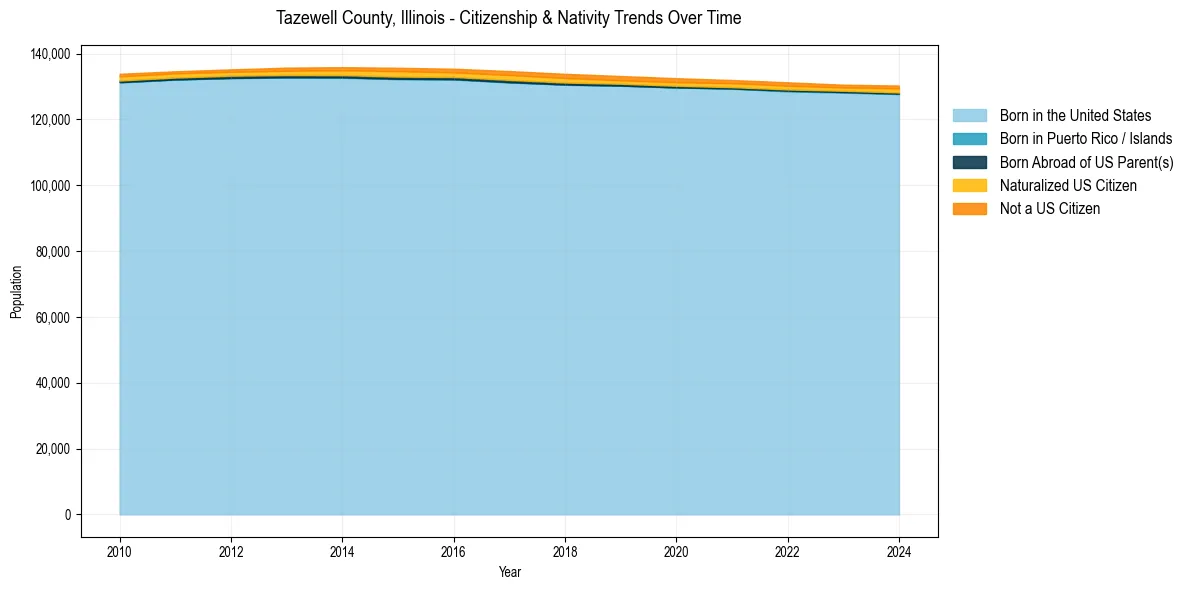
Tazewell County, Illinois Population & Nativity History
| Year | Total Pop | Foreign Born | Native Born |
|---|---|---|---|
| 2024 | 130,290 | 1.6% | 98.4% |
| 2023 | 130,555 | 1.4% | 98.6% |
| 2022 | 131,276 | 1.7% | 98.3% |
| 2021 | 131,977 | 1.6% | 98.4% |
| 2020 | 132,524 | 1.7% | 98.3% |
| 2019 | 133,195 | 1.8% | 98.2% |
| 2018 | 133,852 | 2.0% | 98.0% |
| 2017 | 134,695 | 2.0% | 98.0% |
| 2016 | 135,400 | 1.8% | 98.2% |
| 2015 | 135,697 | 2.0% | 98.0% |
| 2014 | 135,872 | 1.8% | 98.2% |
| 2013 | 135,747 | 1.7% | 98.3% |
| 2012 | 135,201 | 1.4% | 98.6% |
| 2011 | 134,636 | 1.4% | 98.6% |
| 2010 | 133,863 | 1.5% | 98.5% |
Nativity & Citizenship FAQs for Tazewell County, Illinois
Approximately 1.6% of residents in Tazewell County, Illinois were born outside the United States.
The vast majority of residents, roughly 99.3%, are U.S. citizens (including both native-born and naturalized citizens).