St. Clair County, Illinois Nativity & Citizenship Status (2024)
Place of birth and citizenship status analysis for St. Clair County, Illinois
St. Clair County, Illinois Nativity & Citizenship Indicators (2024)
Native Born
96.7%
Foreign Born
3.3%
Naturalized
1.8%
US Citizens
98.5%
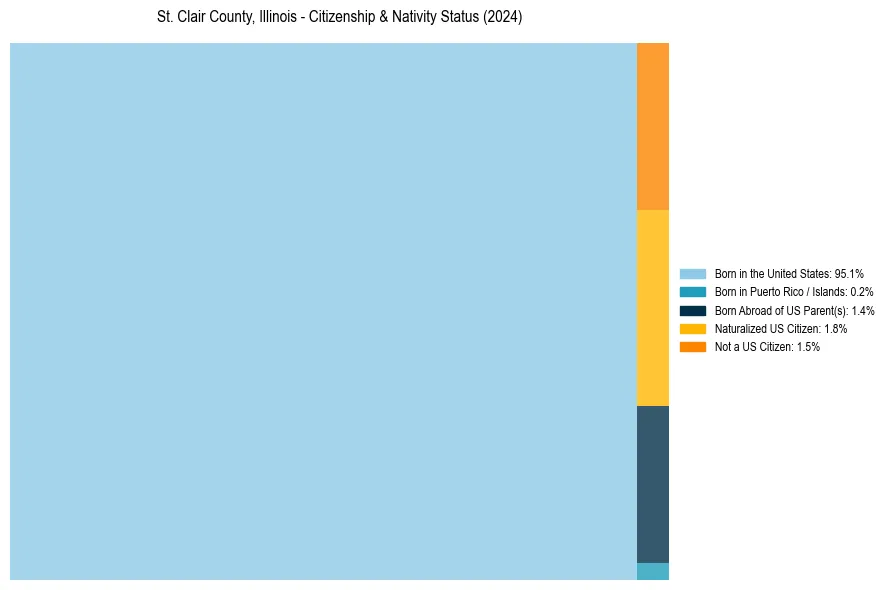
St. Clair County, Illinois Nativity & Citizenship Distribution
St. Clair County, Illinois Historical Nativity Trends (2010–2024)
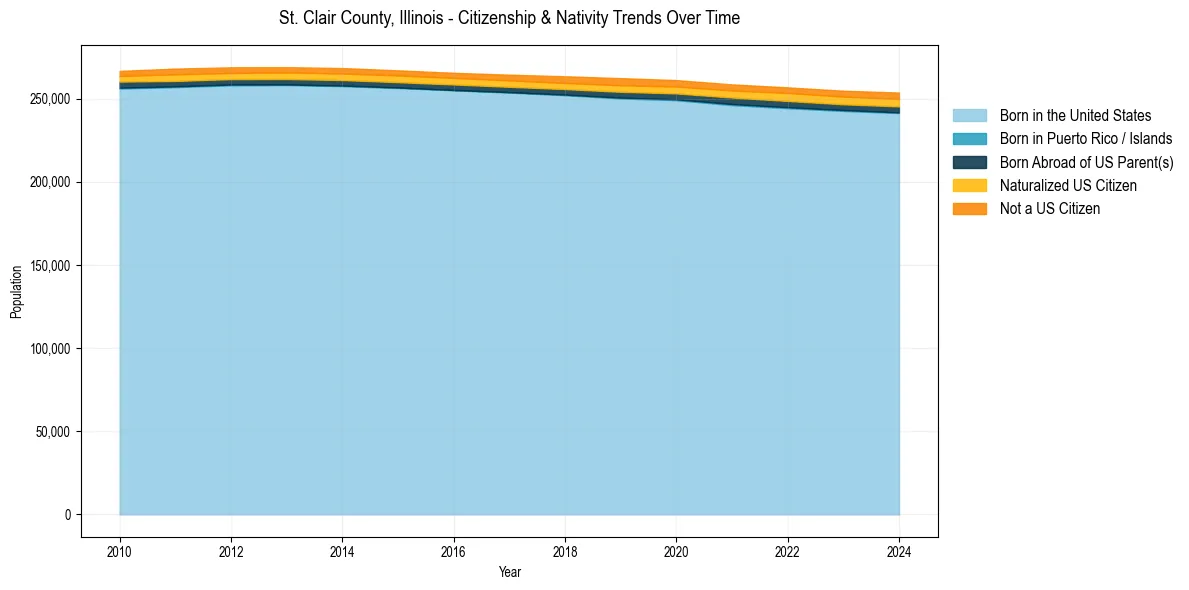
St. Clair County, Illinois Population & Nativity History
| Year | Total Pop | Foreign Born | Native Born |
|---|---|---|---|
| 2024 | 253,694 | 3.3% | 96.7% |
| 2023 | 254,777 | 3.2% | 96.8% |
| 2022 | 256,791 | 3.2% | 96.8% |
| 2021 | 258,597 | 3.1% | 96.9% |
| 2020 | 261,186 | 3.1% | 96.9% |
| 2019 | 262,338 | 3.1% | 96.9% |
| 2018 | 263,463 | 2.9% | 97.1% |
| 2017 | 264,433 | 2.8% | 97.2% |
| 2016 | 265,569 | 2.6% | 97.4% |
| 2015 | 267,029 | 2.7% | 97.3% |
| 2014 | 268,415 | 2.7% | 97.3% |
| 2013 | 268,939 | 2.7% | 97.3% |
| 2012 | 268,873 | 2.6% | 97.4% |
| 2011 | 268,086 | 2.8% | 97.2% |
| 2010 | 266,727 | 2.4% | 97.6% |
Nativity & Citizenship FAQs for St. Clair County, Illinois
Approximately 3.3% of residents in St. Clair County, Illinois were born outside the United States.
The vast majority of residents, roughly 98.5%, are U.S. citizens (including both native-born and naturalized citizens).