Rock Island County, Illinois Nativity & Citizenship Status (2024)
Place of birth and citizenship status analysis for Rock Island County, Illinois
Rock Island County, Illinois Nativity & Citizenship Indicators (2024)
Native Born
91.3%
Foreign Born
8.7%
Naturalized
4.1%
US Citizens
95.4%
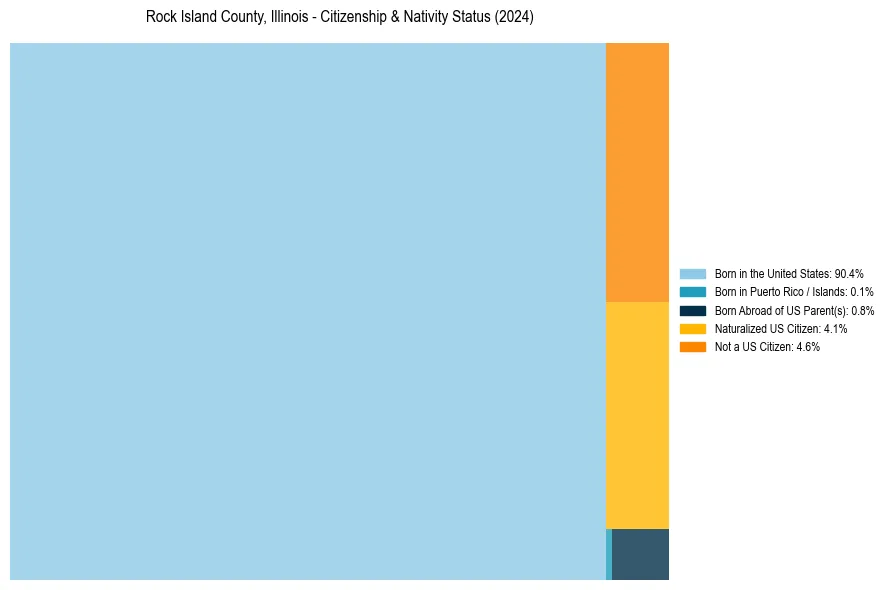
Rock Island County, Illinois Nativity & Citizenship Distribution
Rock Island County, Illinois Historical Nativity Trends (2010–2024)
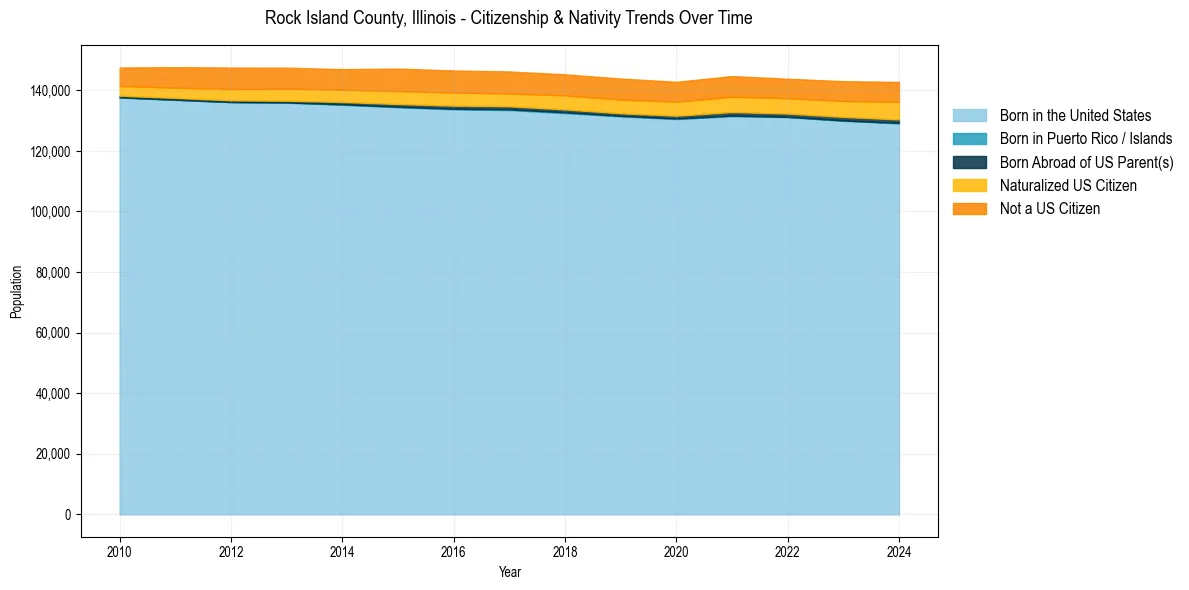
Rock Island County, Illinois Population & Nativity History
| Year | Total Pop | Foreign Born | Native Born |
|---|---|---|---|
| 2024 | 142,757 | 8.7% | 91.3% |
| 2023 | 142,995 | 8.2% | 91.8% |
| 2022 | 143,819 | 8.0% | 92.0% |
| 2021 | 144,694 | 8.2% | 91.8% |
| 2020 | 142,801 | 7.8% | 92.2% |
| 2019 | 143,873 | 8.0% | 92.0% |
| 2018 | 145,275 | 8.0% | 92.0% |
| 2017 | 146,205 | 7.9% | 92.1% |
| 2016 | 146,536 | 7.9% | 92.1% |
| 2015 | 147,161 | 8.0% | 92.0% |
| 2014 | 146,964 | 7.4% | 92.6% |
| 2013 | 147,477 | 7.4% | 92.6% |
| 2012 | 147,504 | 7.3% | 92.7% |
| 2011 | 147,625 | 6.9% | 93.1% |
| 2010 | 147,524 | 6.3% | 93.7% |
Nativity & Citizenship FAQs for Rock Island County, Illinois
Approximately 8.7% of residents in Rock Island County, Illinois were born outside the United States.
The vast majority of residents, roughly 95.4%, are U.S. citizens (including both native-born and naturalized citizens).