Peoria County, Illinois Nativity & Citizenship Status (2024)
Place of birth and citizenship status analysis for Peoria County, Illinois
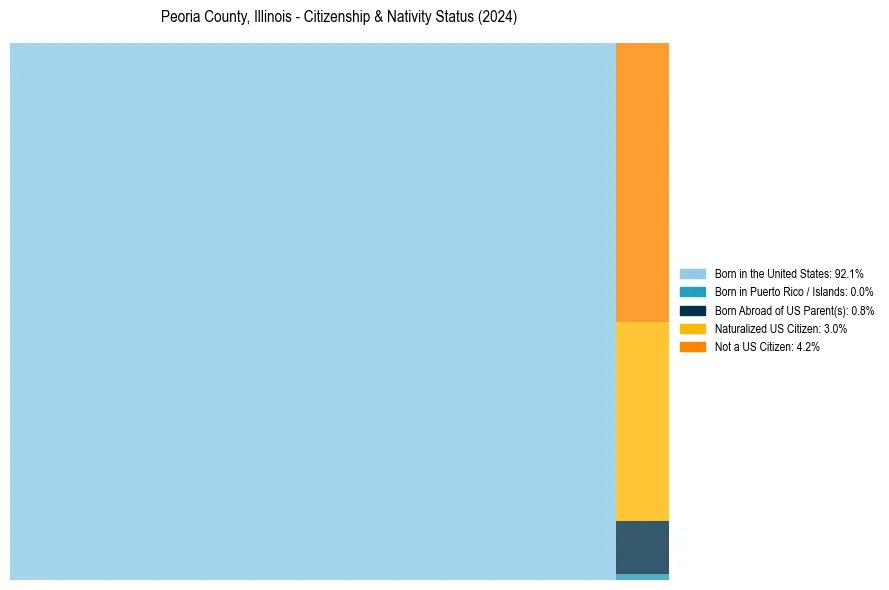
Peoria County, Illinois Nativity & Citizenship Indicators (2024)
Native Born
92.9%
Foreign Born
7.1%
Naturalized
3.0%
US Citizens
95.8%
Peoria County, Illinois Nativity & Citizenship Distribution
Peoria County, Illinois Historical Nativity Trends (2010–2024)
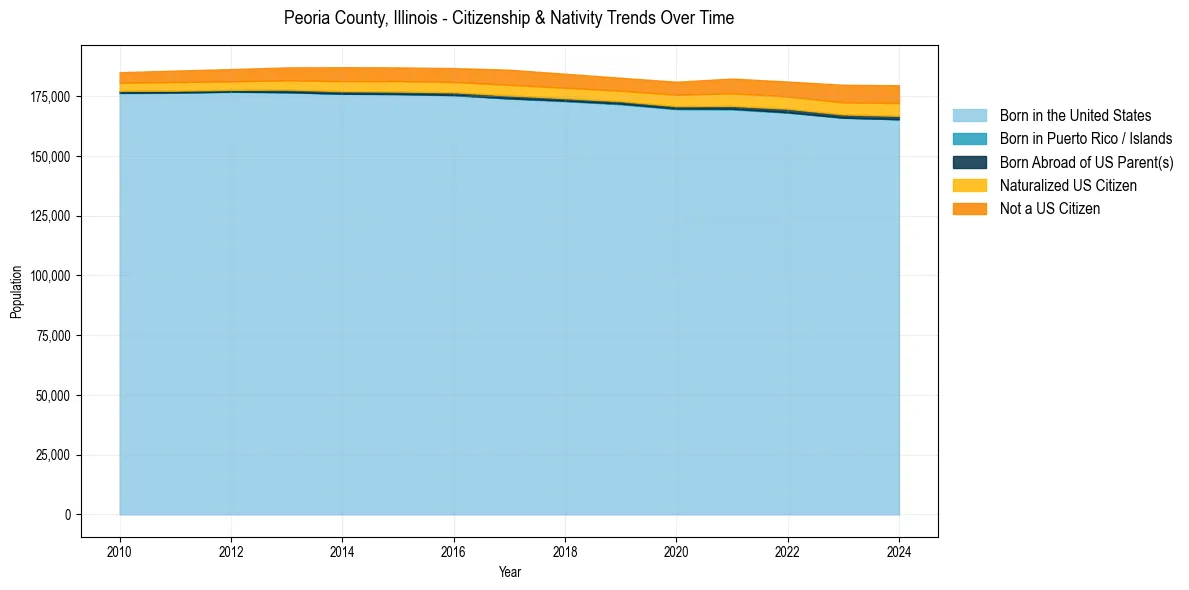
Peoria County, Illinois Population & Nativity History
| Year | Total Pop | Foreign Born | Native Born |
|---|---|---|---|
| 2024 | 179,645 | 7.1% | 92.9% |
| 2023 | 179,831 | 6.9% | 93.1% |
| 2022 | 181,186 | 6.3% | 93.7% |
| 2021 | 182,439 | 6.3% | 93.7% |
| 2020 | 181,111 | 5.6% | 94.4% |
| 2019 | 182,770 | 5.4% | 94.6% |
| 2018 | 184,463 | 5.6% | 94.4% |
| 2017 | 186,145 | 5.8% | 94.2% |
| 2016 | 186,818 | 5.4% | 94.6% |
| 2015 | 187,112 | 5.4% | 94.6% |
| 2014 | 187,197 | 5.4% | 94.6% |
| 2013 | 187,117 | 5.0% | 95.0% |
| 2012 | 186,399 | 4.7% | 95.3% |
| 2011 | 185,780 | 4.5% | 95.5% |
| 2010 | 185,108 | 4.2% | 95.8% |
Nativity & Citizenship FAQs for Peoria County, Illinois
Approximately 7.1% of residents in Peoria County, Illinois were born outside the United States.
The vast majority of residents, roughly 95.8%, are U.S. citizens (including both native-born and naturalized citizens).