Illinois Nativity & Citizenship Status (2024)
Place of birth and citizenship status analysis for Illinois
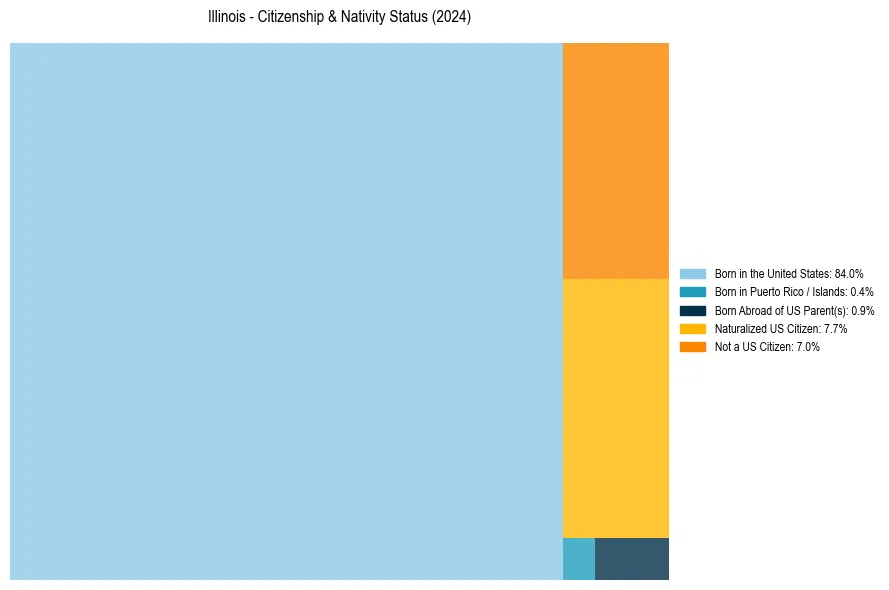
Illinois Nativity & Citizenship Indicators (2024)
Native Born
85.3%
Foreign Born
14.7%
Naturalized
7.7%
US Citizens
93.0%
Illinois Nativity & Citizenship Distribution
Illinois Historical Nativity Trends (2010–2024)
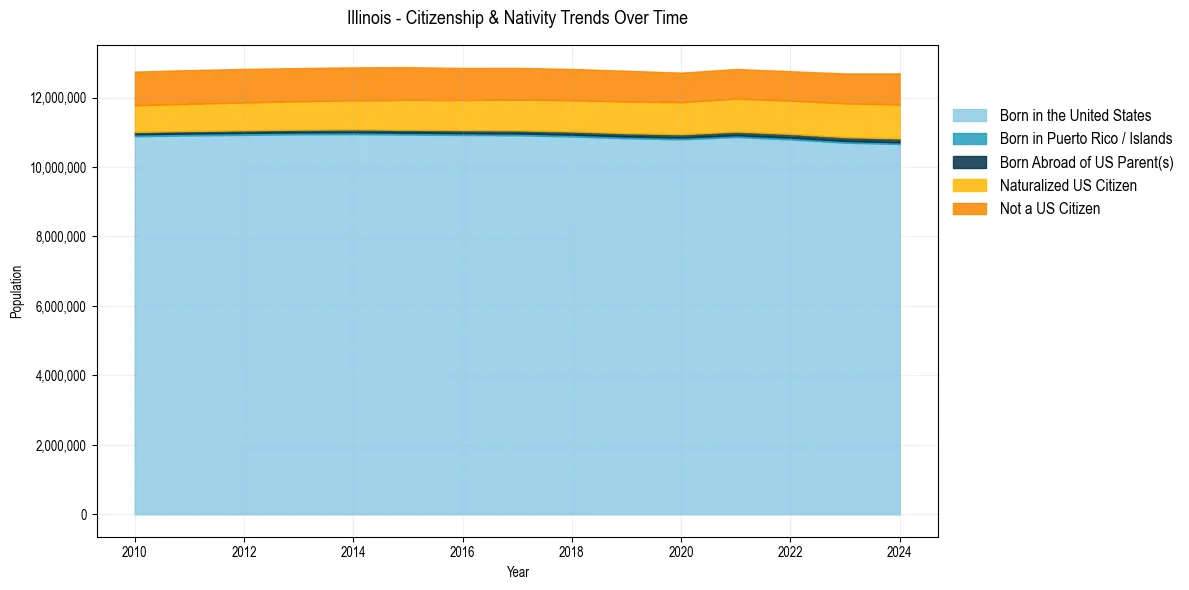
Illinois Population & Nativity History
| Year | Total Pop | Foreign Born | Native Born |
|---|---|---|---|
| 2024 | 12,694,798 | 14.7% | 85.3% |
| 2023 | 12,692,653 | 14.4% | 85.6% |
| 2022 | 12,757,634 | 14.1% | 85.9% |
| 2021 | 12,821,813 | 14.1% | 85.9% |
| 2020 | 12,716,164 | 13.9% | 86.1% |
| 2019 | 12,770,631 | 14.1% | 85.9% |
| 2018 | 12,821,497 | 14.0% | 86.0% |
| 2017 | 12,854,526 | 14.0% | 86.0% |
| 2016 | 12,851,684 | 13.9% | 86.1% |
| 2015 | 12,873,761 | 14.0% | 86.0% |
| 2014 | 12,868,747 | 13.9% | 86.1% |
| 2013 | 12,848,554 | 13.8% | 86.2% |
| 2012 | 12,823,860 | 13.8% | 86.2% |
| 2011 | 12,790,182 | 13.7% | 86.3% |
| 2010 | 12,745,359 | 13.6% | 86.4% |
Nativity & Citizenship FAQs for Illinois
Approximately 14.7% of residents in Illinois were born outside the United States.
The vast majority of residents, roughly 93.0%, are U.S. citizens (including both native-born and naturalized citizens).