McLean County, Illinois Nativity & Citizenship Status (2024)
Place of birth and citizenship status analysis for McLean County, Illinois
McLean County, Illinois Nativity & Citizenship Indicators (2024)
Native Born
92.4%
Foreign Born
7.6%
Naturalized
3.0%
US Citizens
95.4%
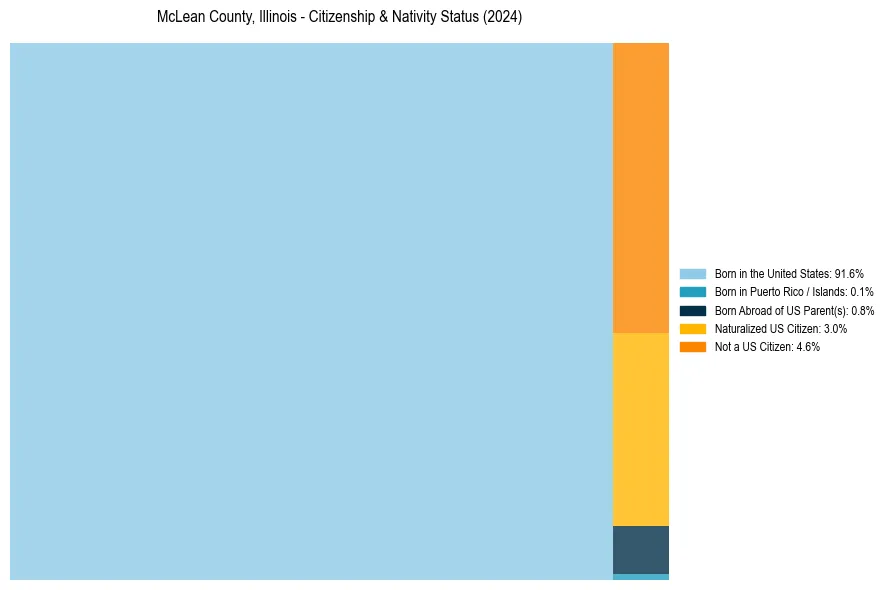
McLean County, Illinois Nativity & Citizenship Distribution
McLean County, Illinois Historical Nativity Trends (2010–2024)
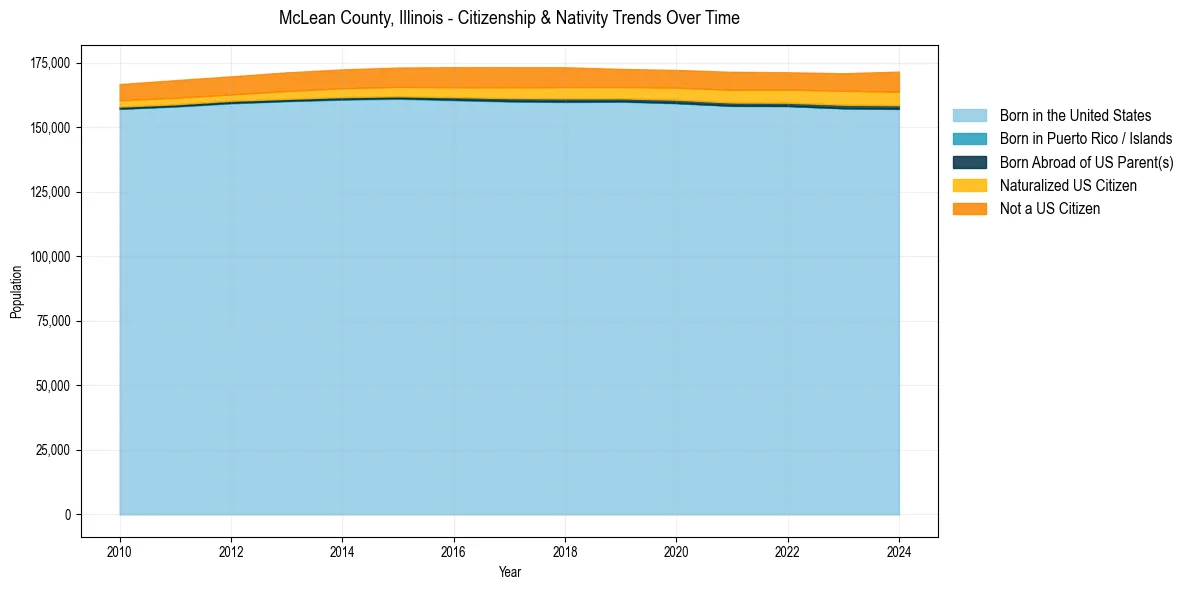
McLean County, Illinois Population & Nativity History
| Year | Total Pop | Foreign Born | Native Born |
|---|---|---|---|
| 2024 | 171,556 | 7.6% | 92.4% |
| 2023 | 170,882 | 7.1% | 92.9% |
| 2022 | 171,284 | 6.9% | 93.1% |
| 2021 | 171,455 | 6.9% | 93.1% |
| 2020 | 172,164 | 6.7% | 93.3% |
| 2019 | 172,578 | 6.6% | 93.4% |
| 2018 | 173,219 | 7.0% | 93.0% |
| 2017 | 173,231 | 6.9% | 93.1% |
| 2016 | 173,254 | 6.7% | 93.3% |
| 2015 | 173,114 | 6.4% | 93.6% |
| 2014 | 172,390 | 6.2% | 93.8% |
| 2013 | 171,240 | 6.0% | 94.0% |
| 2012 | 169,689 | 5.6% | 94.4% |
| 2011 | 168,234 | 5.6% | 94.4% |
| 2010 | 166,706 | 5.2% | 94.8% |
Nativity & Citizenship FAQs for McLean County, Illinois
Approximately 7.6% of residents in McLean County, Illinois were born outside the United States.
The vast majority of residents, roughly 95.4%, are U.S. citizens (including both native-born and naturalized citizens).