Macon County, Illinois Nativity & Citizenship Status (2024)
Place of birth and citizenship status analysis for Macon County, Illinois
Macon County, Illinois Nativity & Citizenship Indicators (2024)
Native Born
97.3%
Foreign Born
2.7%
Naturalized
1.3%
US Citizens
98.6%
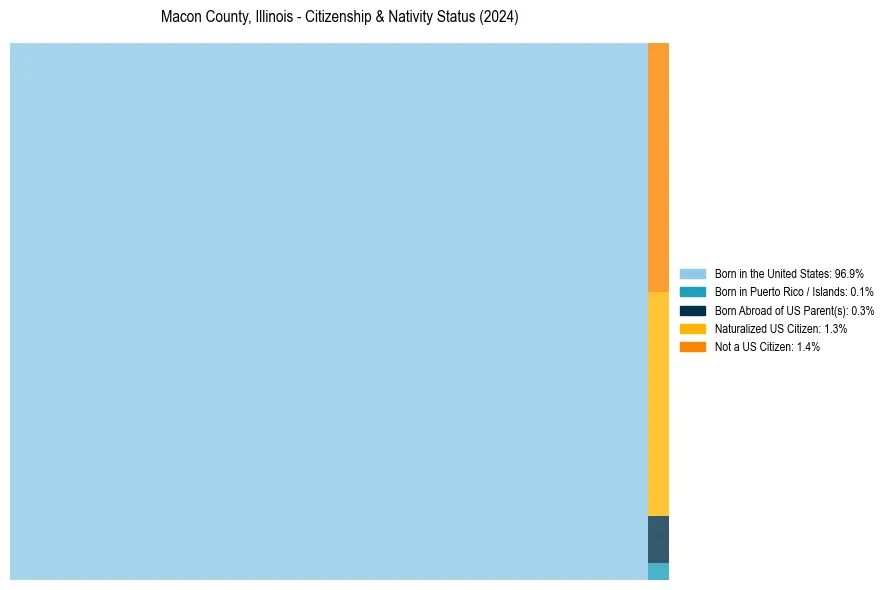
Macon County, Illinois Nativity & Citizenship Distribution
Macon County, Illinois Historical Nativity Trends (2010–2024)
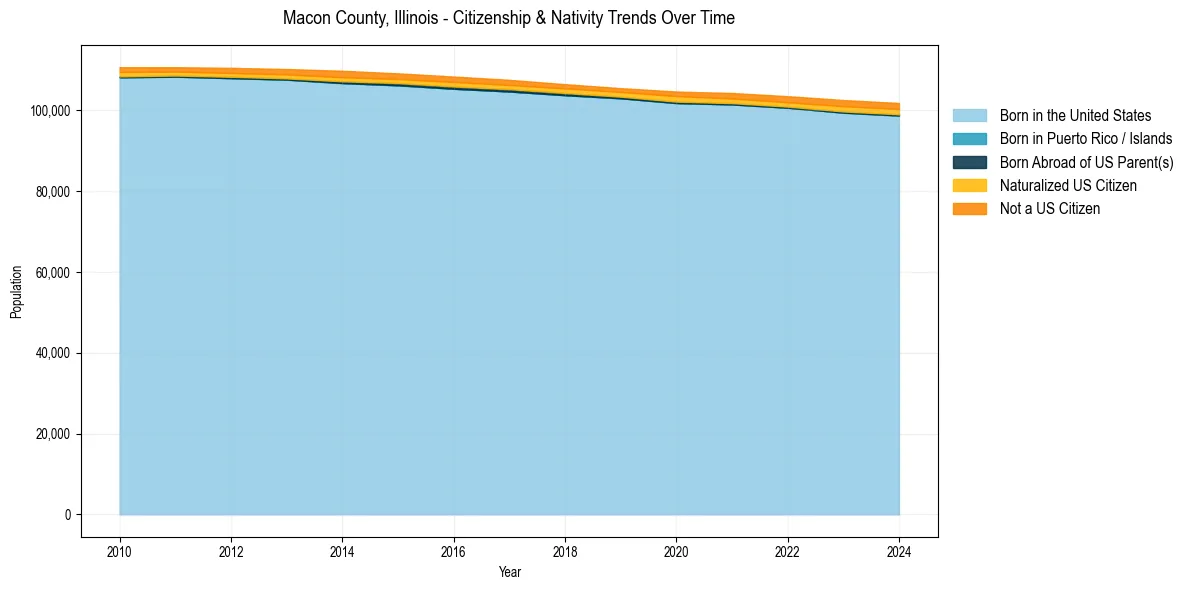
Macon County, Illinois Population & Nativity History
| Year | Total Pop | Foreign Born | Native Born |
|---|---|---|---|
| 2024 | 101,849 | 2.7% | 97.3% |
| 2023 | 102,591 | 2.8% | 97.2% |
| 2022 | 103,542 | 2.5% | 97.5% |
| 2021 | 104,331 | 2.4% | 97.6% |
| 2020 | 104,688 | 2.4% | 97.6% |
| 2019 | 105,528 | 2.0% | 98.0% |
| 2018 | 106,512 | 2.0% | 98.0% |
| 2017 | 107,587 | 2.1% | 97.9% |
| 2016 | 108,404 | 2.3% | 97.7% |
| 2015 | 109,193 | 2.2% | 97.8% |
| 2014 | 109,833 | 2.4% | 97.6% |
| 2013 | 110,262 | 2.1% | 97.9% |
| 2012 | 110,558 | 2.0% | 98.0% |
| 2011 | 110,712 | 1.9% | 98.1% |
| 2010 | 110,719 | 2.1% | 97.9% |
Nativity & Citizenship FAQs for Macon County, Illinois
Approximately 2.7% of residents in Macon County, Illinois were born outside the United States.
The vast majority of residents, roughly 98.6%, are U.S. citizens (including both native-born and naturalized citizens).