Kane County, Illinois Nativity & Citizenship Status (2024)
Place of birth and citizenship status analysis for Kane County, Illinois
Kane County, Illinois Nativity & Citizenship Indicators (2024)
Native Born
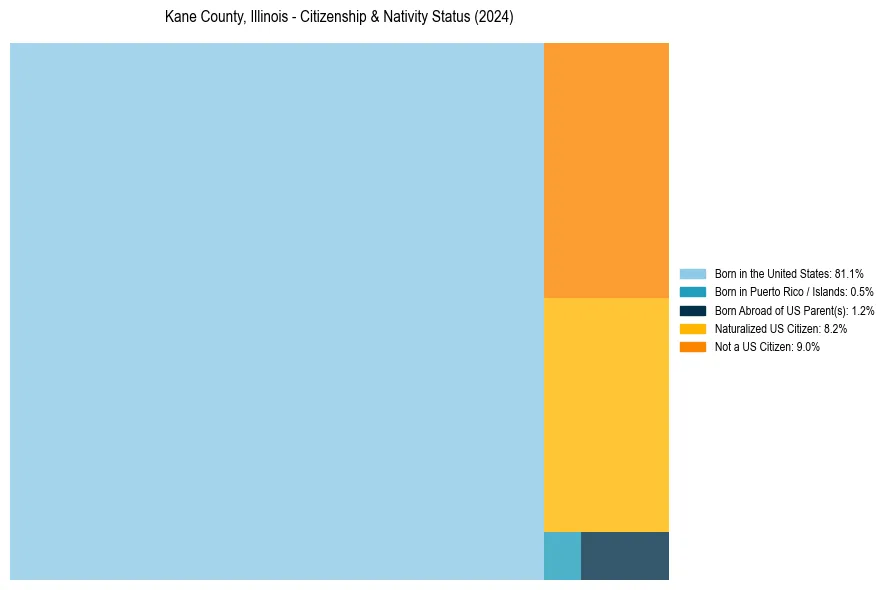
82.8%
Foreign Born
17.2%
Naturalized
8.2%
US Citizens
91.0%
Kane County, Illinois Nativity & Citizenship Distribution
Kane County, Illinois Historical Nativity Trends (2010–2024)
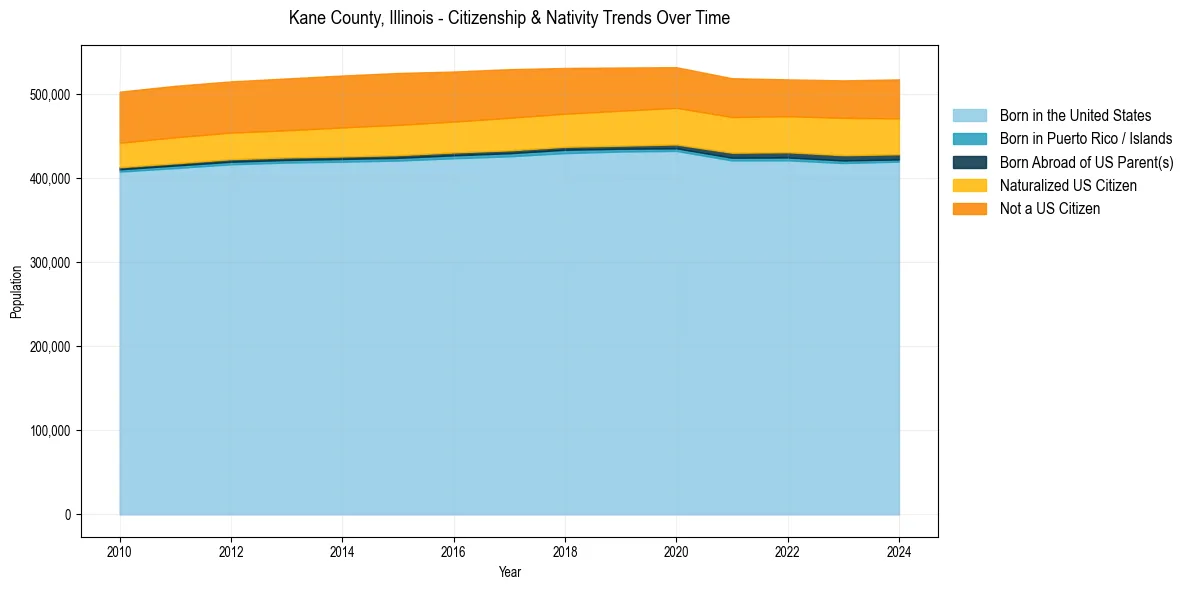
Kane County, Illinois Population & Nativity History
| Year | Total Pop | Foreign Born | Native Born |
|---|---|---|---|
| 2024 | 517,255 | 17.2% | 82.8% |
| 2023 | 516,097 | 17.2% | 82.8% |
| 2022 | 517,254 | 16.7% | 83.3% |
| 2021 | 518,648 | 17.1% | 82.9% |
| 2020 | 531,756 | 17.3% | 82.7% |
| 2019 | 531,376 | 17.5% | 82.5% |
| 2018 | 530,839 | 17.7% | 82.3% |
| 2017 | 529,402 | 18.2% | 81.8% |
| 2016 | 526,615 | 18.3% | 81.7% |
| 2015 | 524,886 | 18.6% | 81.4% |
| 2014 | 521,874 | 18.5% | 81.5% |
| 2013 | 518,380 | 18.1% | 81.9% |
| 2012 | 514,891 | 18.0% | 82.0% |
| 2011 | 509,622 | 18.1% | 81.9% |
| 2010 | 502,628 | 17.9% | 82.1% |
Nativity & Citizenship FAQs for Kane County, Illinois
Approximately 17.2% of residents in Kane County, Illinois were born outside the United States.
The vast majority of residents, roughly 91.0%, are U.S. citizens (including both native-born and naturalized citizens).