DuPage County, Illinois Nativity & Citizenship Status (2024)
Place of birth and citizenship status analysis for DuPage County, Illinois
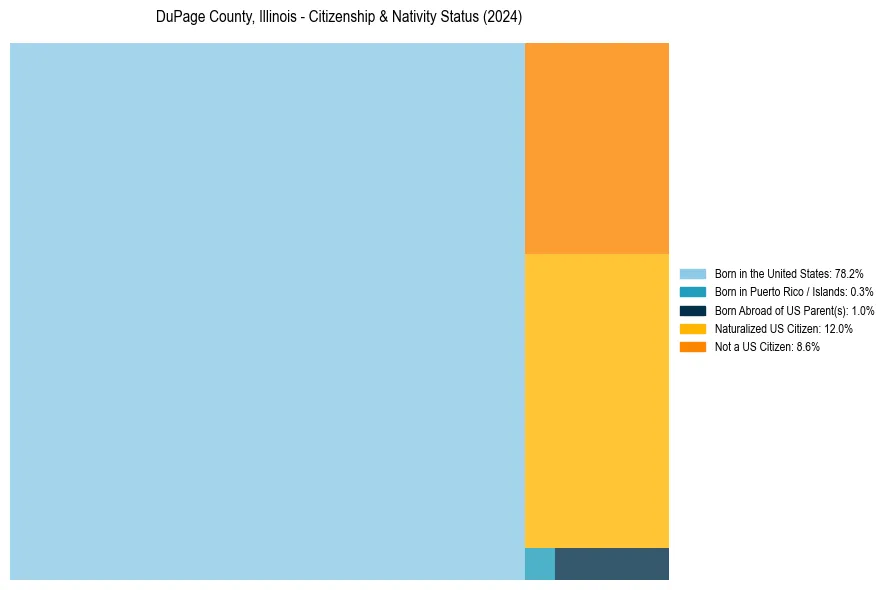
DuPage County, Illinois Nativity & Citizenship Indicators (2024)
Native Born
79.5%
Foreign Born
20.5%
Naturalized
12.0%
US Citizens
91.4%
DuPage County, Illinois Nativity & Citizenship Distribution
DuPage County, Illinois Historical Nativity Trends (2010–2024)
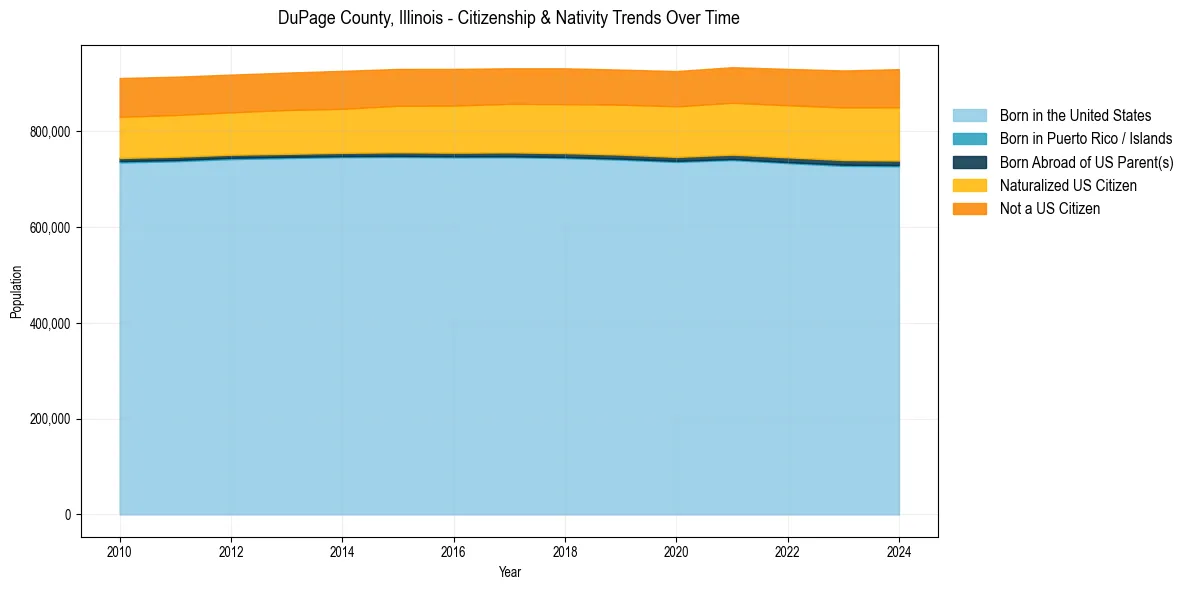
DuPage County, Illinois Population & Nativity History
| Year | Total Pop | Foreign Born | Native Born |
|---|---|---|---|
| 2024 | 930,024 | 20.5% | 79.5% |
| 2023 | 927,263 | 20.2% | 79.8% |
| 2022 | 930,559 | 19.9% | 80.1% |
| 2021 | 934,094 | 19.6% | 80.4% |
| 2020 | 926,005 | 19.4% | 80.6% |
| 2019 | 929,060 | 19.1% | 80.9% |
| 2018 | 931,743 | 19.0% | 81.0% |
| 2017 | 931,826 | 18.9% | 81.1% |
| 2016 | 930,514 | 18.8% | 81.2% |
| 2015 | 930,412 | 18.7% | 81.3% |
| 2014 | 926,485 | 18.5% | 81.5% |
| 2013 | 922,803 | 18.4% | 81.6% |
| 2012 | 918,608 | 18.2% | 81.8% |
| 2011 | 914,224 | 18.3% | 81.7% |
| 2010 | 911,481 | 18.3% | 81.7% |
Nativity & Citizenship FAQs for DuPage County, Illinois
Approximately 20.5% of residents in DuPage County, Illinois were born outside the United States.
The vast majority of residents, roughly 91.4%, are U.S. citizens (including both native-born and naturalized citizens).