Cook County, Illinois Nativity & Citizenship Status (2024)
Place of birth and citizenship status analysis for Cook County, Illinois
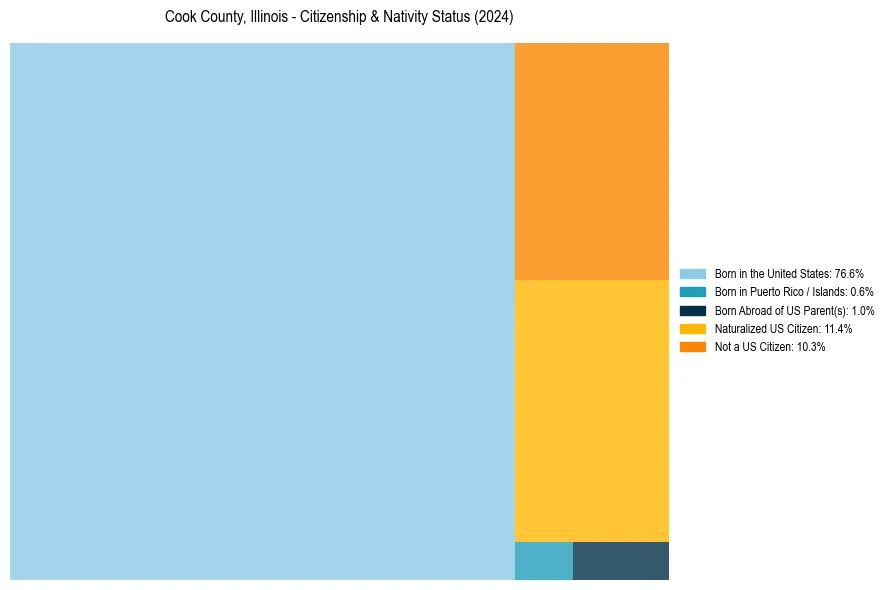
Cook County, Illinois Nativity & Citizenship Indicators (2024)
Native Born
78.3%
Foreign Born
21.7%
Naturalized
11.4%
US Citizens
89.7%
Cook County, Illinois Nativity & Citizenship Distribution
Cook County, Illinois Historical Nativity Trends (2010–2024)
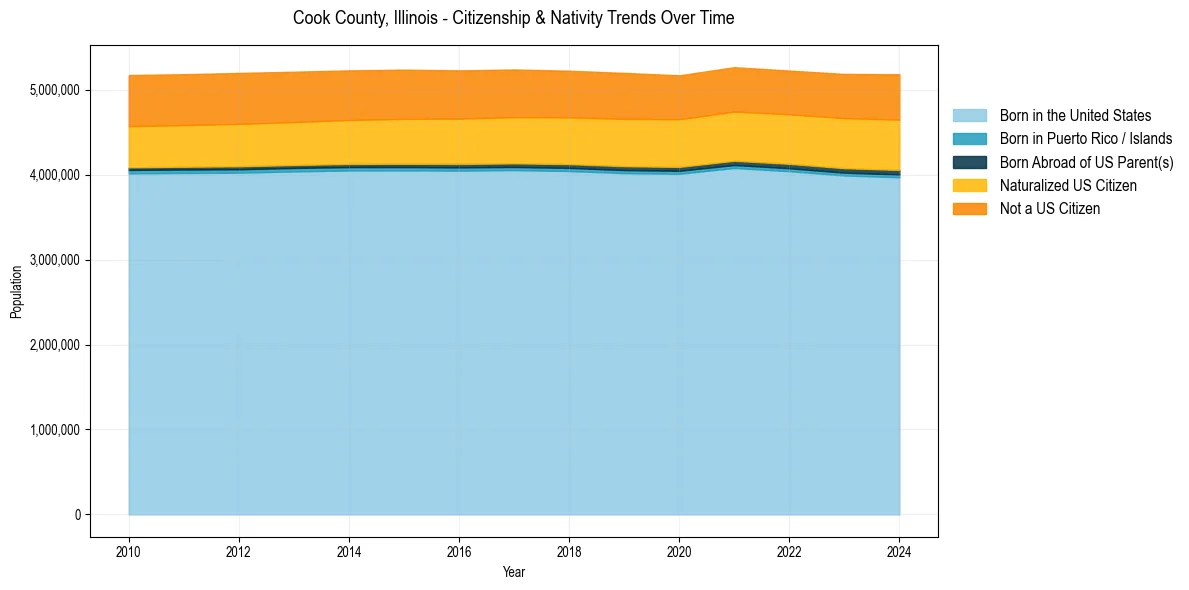
Cook County, Illinois Population & Nativity History
| Year | Total Pop | Foreign Born | Native Born |
|---|---|---|---|
| 2024 | 5,182,090 | 21.7% | 78.3% |
| 2023 | 5,185,812 | 21.4% | 78.6% |
| 2022 | 5,225,367 | 21.0% | 79.0% |
| 2021 | 5,265,398 | 20.9% | 79.1% |
| 2020 | 5,169,517 | 20.9% | 79.1% |
| 2019 | 5,198,275 | 21.1% | 78.9% |
| 2018 | 5,223,719 | 21.1% | 78.9% |
| 2017 | 5,238,541 | 21.1% | 78.9% |
| 2016 | 5,227,575 | 21.1% | 78.9% |
| 2015 | 5,236,393 | 21.2% | 78.8% |
| 2014 | 5,227,827 | 21.1% | 78.9% |
| 2013 | 5,212,372 | 21.1% | 78.9% |
| 2012 | 5,197,677 | 21.2% | 78.8% |
| 2011 | 5,182,969 | 21.0% | 79.0% |
| 2010 | 5,172,848 | 21.0% | 79.0% |
Nativity & Citizenship FAQs for Cook County, Illinois
Approximately 21.7% of residents in Cook County, Illinois were born outside the United States.
The vast majority of residents, roughly 89.7%, are U.S. citizens (including both native-born and naturalized citizens).