Champaign County, Illinois Nativity & Citizenship Status (2024)
Place of birth and citizenship status analysis for Champaign County, Illinois
Champaign County, Illinois Nativity & Citizenship Indicators (2024)
Native Born
85.8%
Foreign Born
14.2%
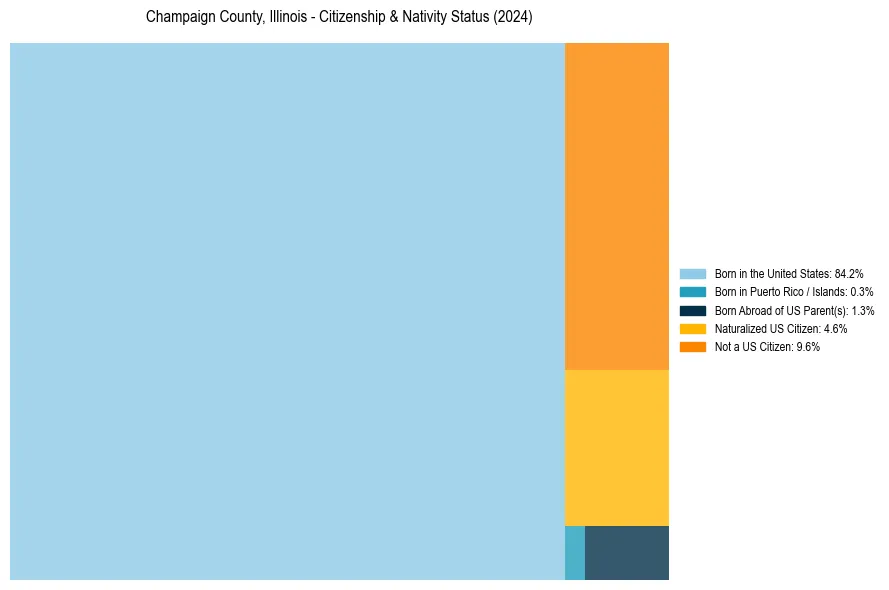
Naturalized
4.6%
US Citizens
90.4%
Champaign County, Illinois Nativity & Citizenship Distribution
Champaign County, Illinois Historical Nativity Trends (2010–2024)
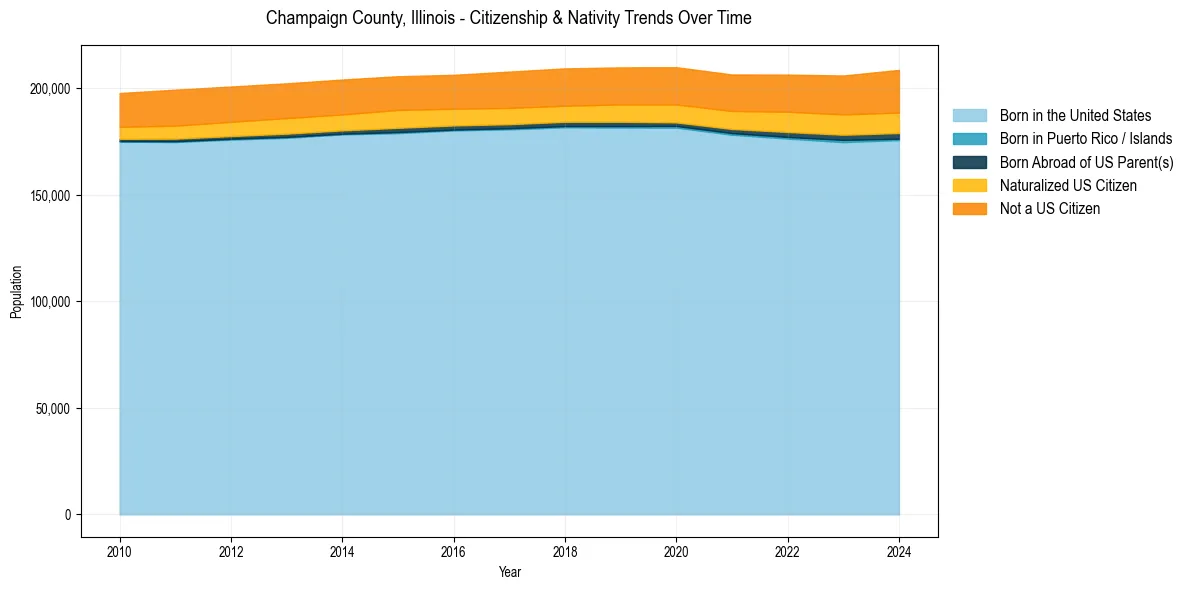
Champaign County, Illinois Population & Nativity History
| Year | Total Pop | Foreign Born | Native Born |
|---|---|---|---|
| 2024 | 208,741 | 14.2% | 85.8% |
| 2023 | 206,098 | 13.5% | 86.5% |
| 2022 | 206,525 | 13.1% | 86.9% |
| 2021 | 206,583 | 12.4% | 87.6% |
| 2020 | 210,006 | 12.3% | 87.7% |
| 2019 | 209,922 | 12.2% | 87.8% |
| 2018 | 209,448 | 12.0% | 88.0% |
| 2017 | 207,946 | 11.9% | 88.1% |
| 2016 | 206,420 | 11.5% | 88.5% |
| 2015 | 205,766 | 11.8% | 88.2% |
| 2014 | 204,214 | 11.7% | 88.3% |
| 2013 | 202,428 | 11.7% | 88.3% |
| 2012 | 200,931 | 11.6% | 88.4% |
| 2011 | 199,443 | 11.5% | 88.5% |
| 2010 | 197,867 | 10.9% | 89.1% |
Nativity & Citizenship FAQs for Champaign County, Illinois
Approximately 14.2% of residents in Champaign County, Illinois were born outside the United States.
The vast majority of residents, roughly 90.4%, are U.S. citizens (including both native-born and naturalized citizens).