Nez Perce County, Idaho Nativity & Citizenship Status (2024)
Place of birth and citizenship status analysis for Nez Perce County, Idaho
Nez Perce County, Idaho Nativity & Citizenship Indicators (2024)
Native Born
98.3%
Foreign Born
1.7%
Naturalized
1.2%
US Citizens
99.5%
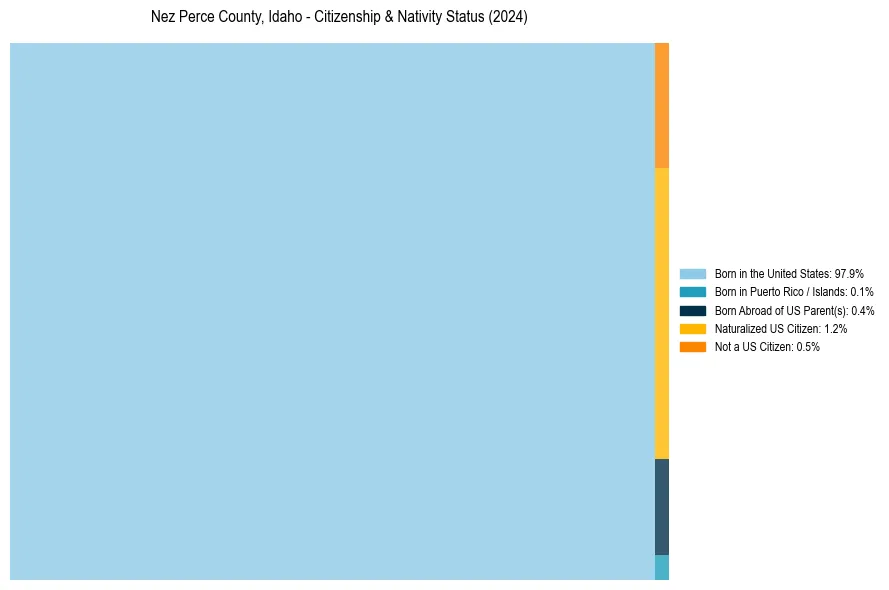
Nez Perce County, Idaho Nativity & Citizenship Distribution
Nez Perce County, Idaho Historical Nativity Trends (2010–2024)
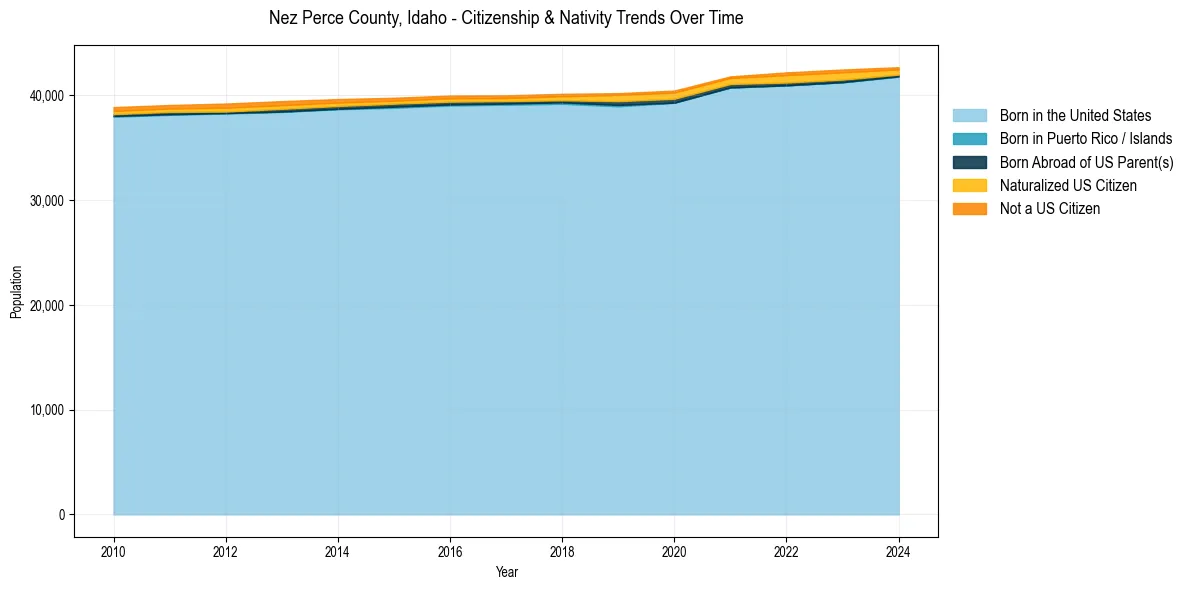
Nez Perce County, Idaho Population & Nativity History
| Year | Total Pop | Foreign Born | Native Born |
|---|---|---|---|
| 2024 | 42,697 | 1.7% | 98.3% |
| 2023 | 42,477 | 2.3% | 97.7% |
| 2022 | 42,200 | 2.3% | 97.7% |
| 2021 | 41,820 | 1.7% | 98.3% |
| 2020 | 40,468 | 1.9% | 98.1% |
| 2019 | 40,217 | 1.9% | 98.1% |
| 2018 | 40,155 | 1.5% | 98.5% |
| 2017 | 40,014 | 1.4% | 98.6% |
| 2016 | 39,995 | 1.5% | 98.5% |
| 2015 | 39,779 | 1.4% | 98.6% |
| 2014 | 39,655 | 1.7% | 98.3% |
| 2013 | 39,458 | 1.9% | 98.1% |
| 2012 | 39,226 | 2.0% | 98.0% |
| 2011 | 39,088 | 1.7% | 98.3% |
| 2010 | 38,886 | 1.7% | 98.3% |
Nativity & Citizenship FAQs for Nez Perce County, Idaho
Approximately 1.7% of residents in Nez Perce County, Idaho were born outside the United States.
The vast majority of residents, roughly 99.5%, are U.S. citizens (including both native-born and naturalized citizens).