Idaho Nativity & Citizenship Status (2024)
Place of birth and citizenship status analysis for Idaho
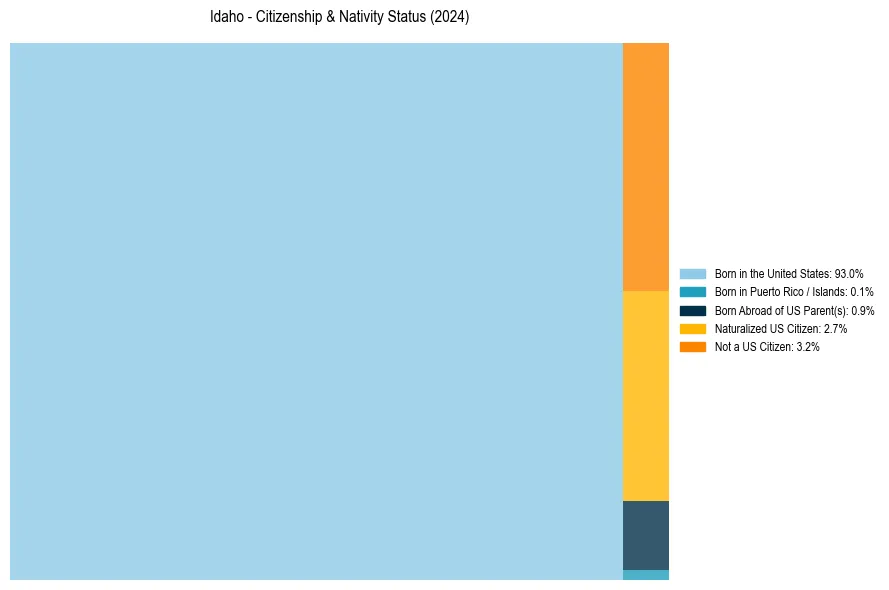
Idaho Nativity & Citizenship Indicators (2024)
Native Born
94.1%
Foreign Born
5.9%
Naturalized
2.7%
US Citizens
96.8%
Idaho Nativity & Citizenship Distribution
Idaho Historical Nativity Trends (2010–2024)
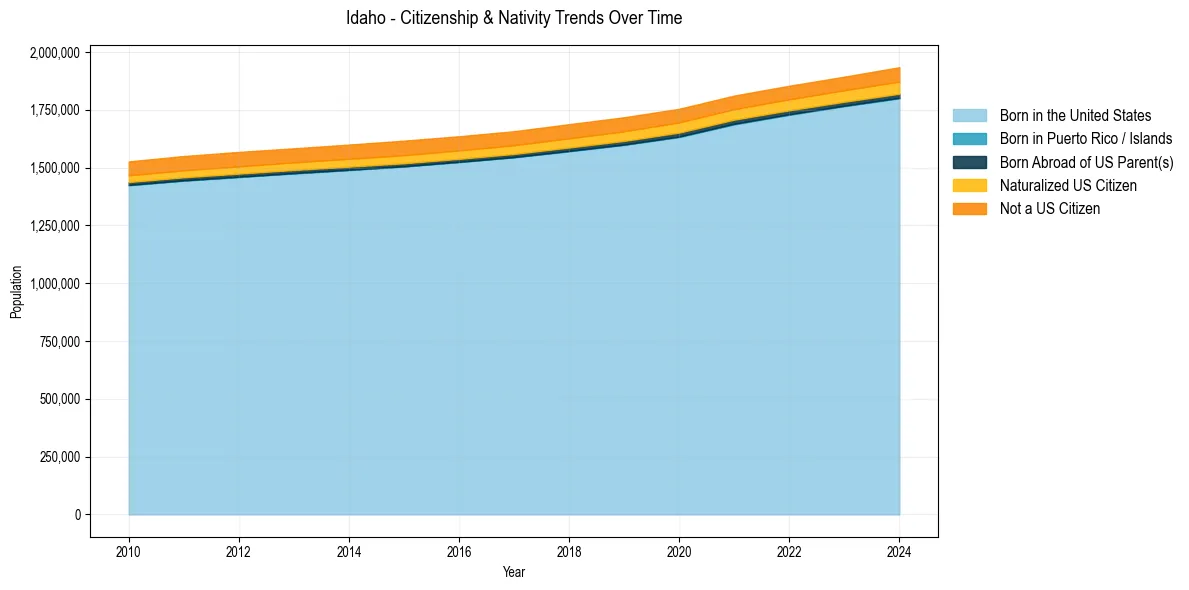
Idaho Population & Nativity History
| Year | Total Pop | Foreign Born | Native Born |
|---|---|---|---|
| 2024 | 1,934,262 | 5.9% | 94.1% |
| 2023 | 1,893,296 | 5.7% | 94.3% |
| 2022 | 1,854,109 | 5.7% | 94.3% |
| 2021 | 1,811,617 | 5.8% | 94.2% |
| 2020 | 1,754,367 | 5.9% | 94.1% |
| 2019 | 1,717,750 | 6.0% | 94.0% |
| 2018 | 1,687,809 | 6.0% | 94.0% |
| 2017 | 1,657,375 | 5.9% | 94.1% |
| 2016 | 1,635,483 | 6.0% | 94.0% |
| 2015 | 1,616,547 | 6.1% | 93.9% |
| 2014 | 1,599,464 | 6.0% | 94.0% |
| 2013 | 1,583,364 | 5.9% | 94.1% |
| 2012 | 1,567,803 | 6.0% | 94.0% |
| 2011 | 1,549,987 | 5.9% | 94.1% |
| 2010 | 1,526,797 | 5.9% | 94.1% |
Nativity & Citizenship FAQs for Idaho
Approximately 5.9% of residents in Idaho were born outside the United States.
The vast majority of residents, roughly 96.8%, are U.S. citizens (including both native-born and naturalized citizens).