Minidoka County, Idaho Nativity & Citizenship Status (2024)
Place of birth and citizenship status analysis for Minidoka County, Idaho
Minidoka County, Idaho Nativity & Citizenship Indicators (2024)
Native Born
88.2%
Foreign Born
11.8%
Naturalized
5.9%
US Citizens
94.1%
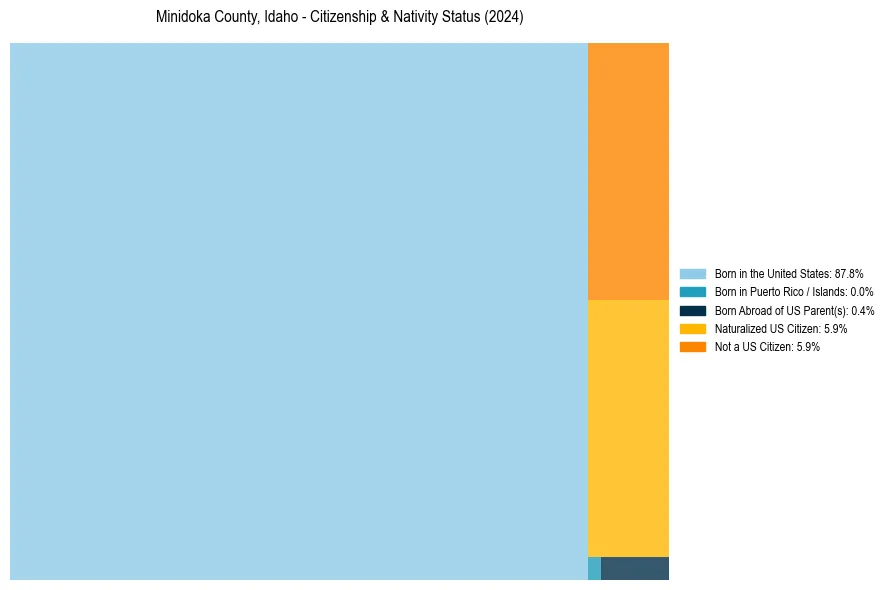
Minidoka County, Idaho Nativity & Citizenship Distribution
Minidoka County, Idaho Historical Nativity Trends (2010–2024)
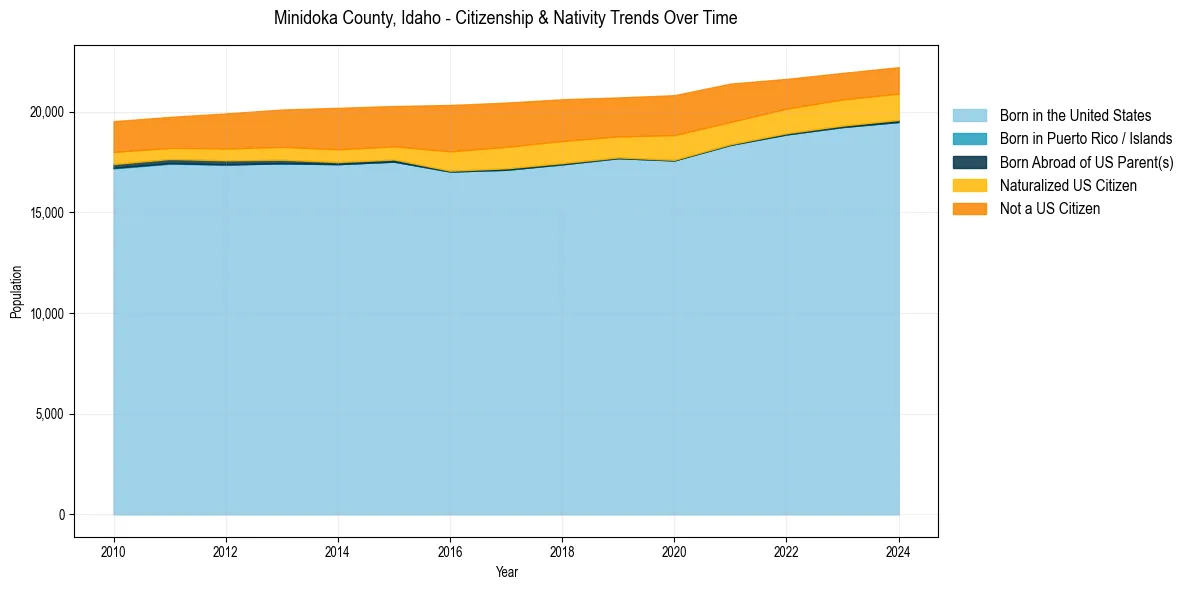
Minidoka County, Idaho Population & Nativity History
| Year | Total Pop | Foreign Born | Native Born |
|---|---|---|---|
| 2024 | 22,208 | 11.8% | 88.2% |
| 2023 | 21,922 | 11.9% | 88.1% |
| 2022 | 21,626 | 12.5% | 87.5% |
| 2021 | 21,393 | 14.1% | 85.9% |
| 2020 | 20,817 | 15.4% | 84.6% |
| 2019 | 20,705 | 14.4% | 85.6% |
| 2018 | 20,615 | 15.4% | 84.6% |
| 2017 | 20,448 | 16.0% | 84.0% |
| 2016 | 20,331 | 16.1% | 83.9% |
| 2015 | 20,279 | 13.1% | 86.9% |
| 2014 | 20,191 | 13.4% | 86.6% |
| 2013 | 20,104 | 12.4% | 87.6% |
| 2012 | 19,909 | 11.7% | 88.3% |
| 2011 | 19,740 | 10.6% | 89.4% |
| 2010 | 19,524 | 10.9% | 89.1% |
Nativity & Citizenship FAQs for Minidoka County, Idaho
Approximately 11.8% of residents in Minidoka County, Idaho were born outside the United States.
The vast majority of residents, roughly 94.1%, are U.S. citizens (including both native-born and naturalized citizens).