Gooding County, Idaho Nativity & Citizenship Status (2024)
Place of birth and citizenship status analysis for Gooding County, Idaho
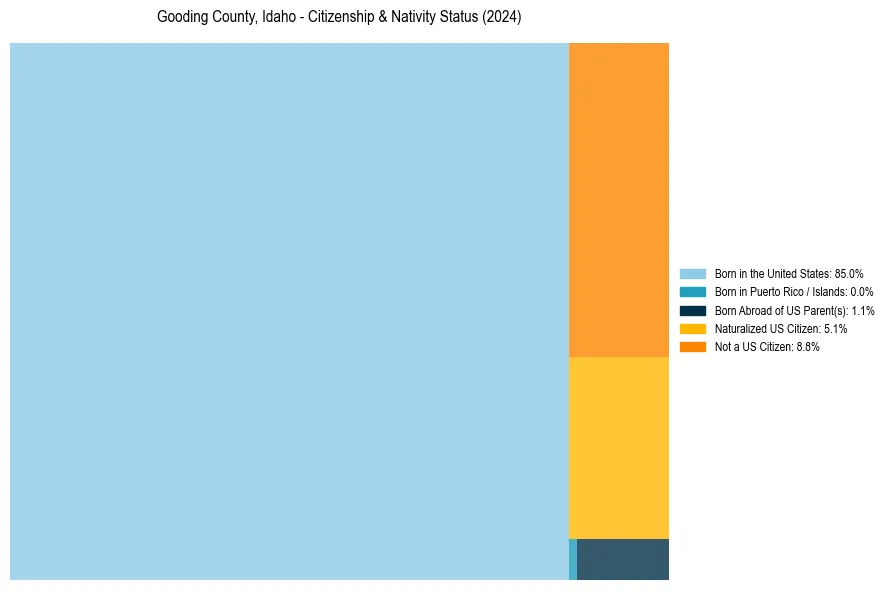
Gooding County, Idaho Nativity & Citizenship Indicators (2024)
Native Born
86.0%
Foreign Born
14.0%
Naturalized
5.1%
US Citizens
91.2%
Gooding County, Idaho Nativity & Citizenship Distribution
Gooding County, Idaho Historical Nativity Trends (2010–2024)
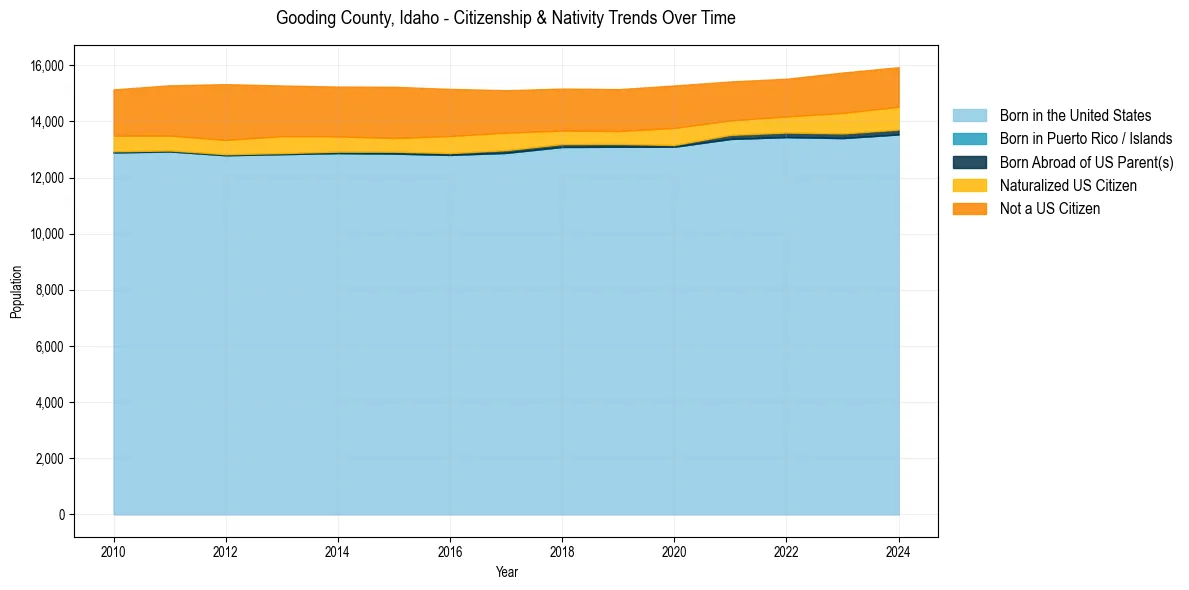
Gooding County, Idaho Population & Nativity History
| Year | Total Pop | Foreign Born | Native Born |
|---|---|---|---|
| 2024 | 15,931 | 14.0% | 86.0% |
| 2023 | 15,740 | 13.8% | 86.2% |
| 2022 | 15,520 | 12.4% | 87.6% |
| 2021 | 15,422 | 12.3% | 87.7% |
| 2020 | 15,280 | 13.9% | 86.1% |
| 2019 | 15,148 | 12.9% | 87.1% |
| 2018 | 15,169 | 13.0% | 87.0% |
| 2017 | 15,110 | 14.1% | 85.9% |
| 2016 | 15,157 | 15.1% | 84.9% |
| 2015 | 15,233 | 15.2% | 84.8% |
| 2014 | 15,241 | 15.2% | 84.8% |
| 2013 | 15,278 | 15.8% | 84.2% |
| 2012 | 15,327 | 16.3% | 83.7% |
| 2011 | 15,285 | 15.2% | 84.8% |
| 2010 | 15,140 | 14.6% | 85.4% |
Nativity & Citizenship FAQs for Gooding County, Idaho
Approximately 14.0% of residents in Gooding County, Idaho were born outside the United States.
The vast majority of residents, roughly 91.2%, are U.S. citizens (including both native-born and naturalized citizens).