Clark County, Idaho Nativity & Citizenship Status (2024)
Place of birth and citizenship status analysis for Clark County, Idaho
Clark County, Idaho Nativity & Citizenship Indicators (2024)
Native Born
80.7%
Foreign Born
19.3%
Naturalized
4.1%
US Citizens
84.8%
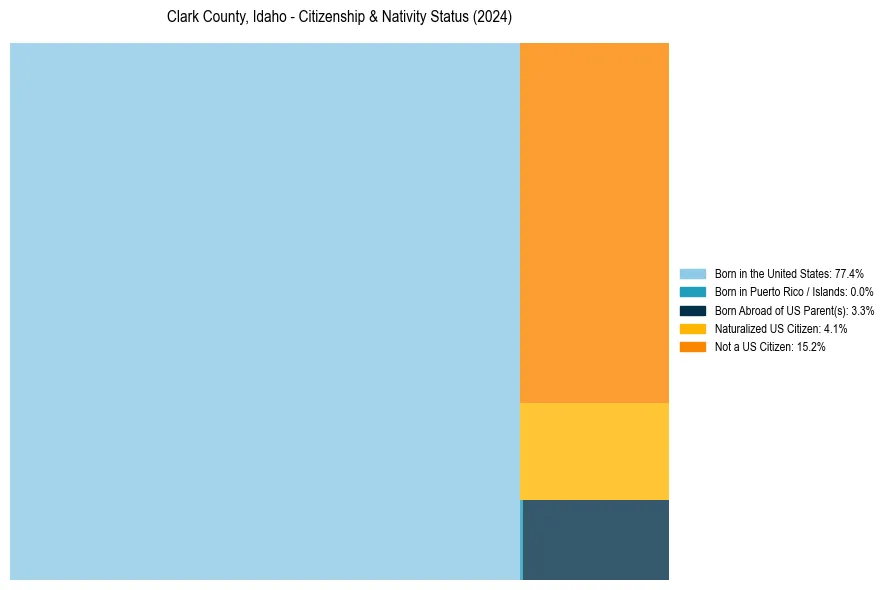
Clark County, Idaho Nativity & Citizenship Distribution
Clark County, Idaho Historical Nativity Trends (2010–2024)
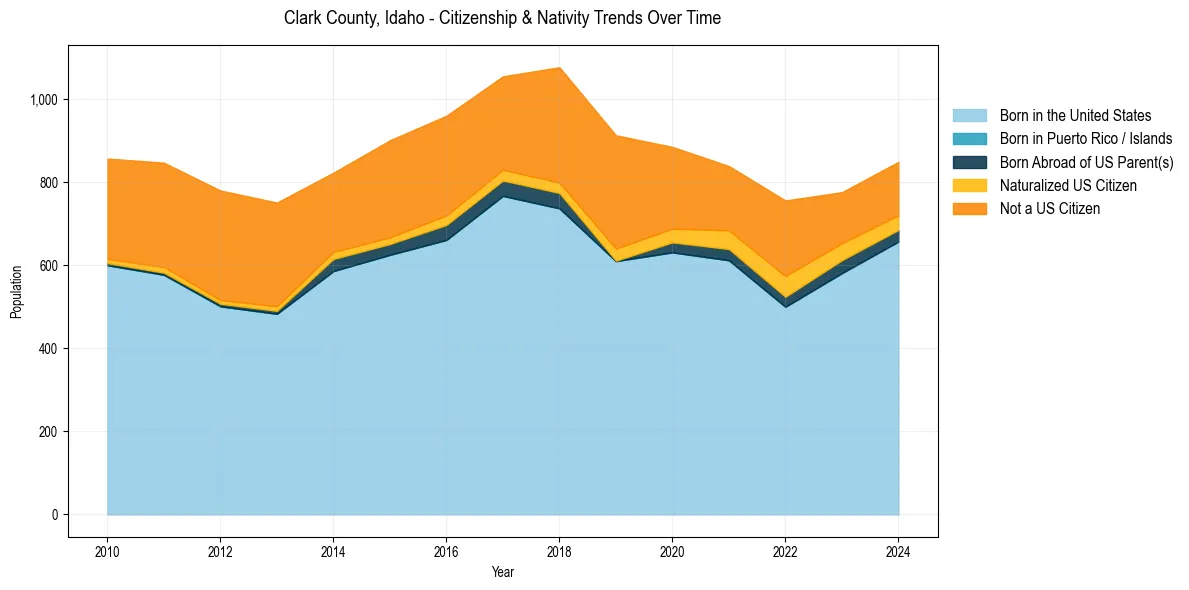
Clark County, Idaho Population & Nativity History
| Year | Total Pop | Foreign Born | Native Born |
|---|---|---|---|
| 2024 | 849 | 19.3% | 80.7% |
| 2023 | 776 | 21.1% | 78.9% |
| 2022 | 756 | 30.7% | 69.3% |
| 2021 | 839 | 23.8% | 76.2% |
| 2020 | 885 | 26.0% | 74.0% |
| 2019 | 913 | 33.1% | 66.9% |
| 2018 | 1,077 | 28.1% | 71.9% |
| 2017 | 1,055 | 23.8% | 76.2% |
| 2016 | 960 | 27.4% | 72.6% |
| 2015 | 901 | 27.7% | 72.3% |
| 2014 | 823 | 25.3% | 74.7% |
| 2013 | 751 | 34.8% | 65.2% |
| 2012 | 780 | 35.0% | 65.0% |
| 2011 | 847 | 31.3% | 68.7% |
| 2010 | 857 | 29.4% | 70.6% |
Nativity & Citizenship FAQs for Clark County, Idaho
Approximately 19.3% of residents in Clark County, Idaho were born outside the United States.
The vast majority of residents, roughly 84.8%, are U.S. citizens (including both native-born and naturalized citizens).