Canyon County, Idaho Nativity & Citizenship Status (2024)
Place of birth and citizenship status analysis for Canyon County, Idaho
Canyon County, Idaho Nativity & Citizenship Indicators (2024)
Native Born
91.3%
Foreign Born
8.7%
Naturalized
3.8%
US Citizens
95.1%
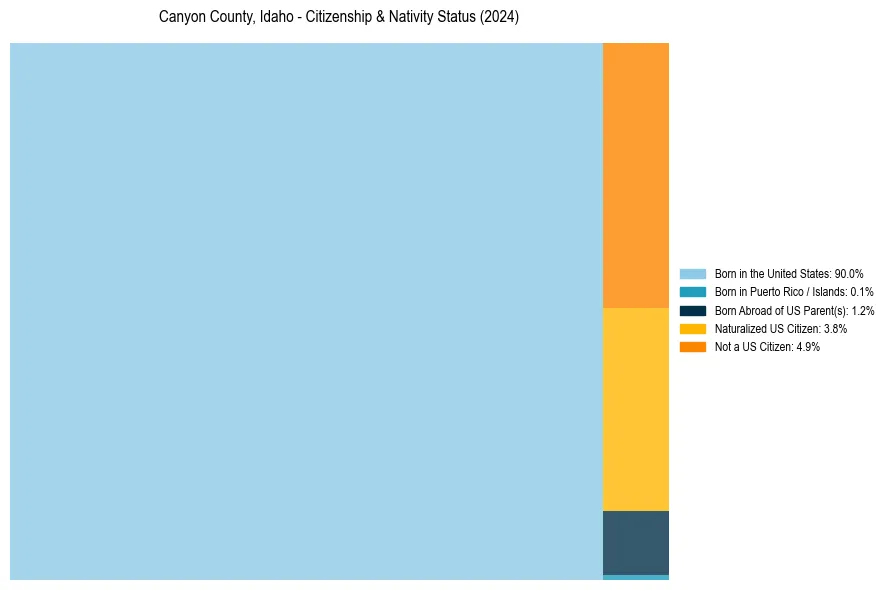
Canyon County, Idaho Nativity & Citizenship Distribution
Canyon County, Idaho Historical Nativity Trends (2010–2024)
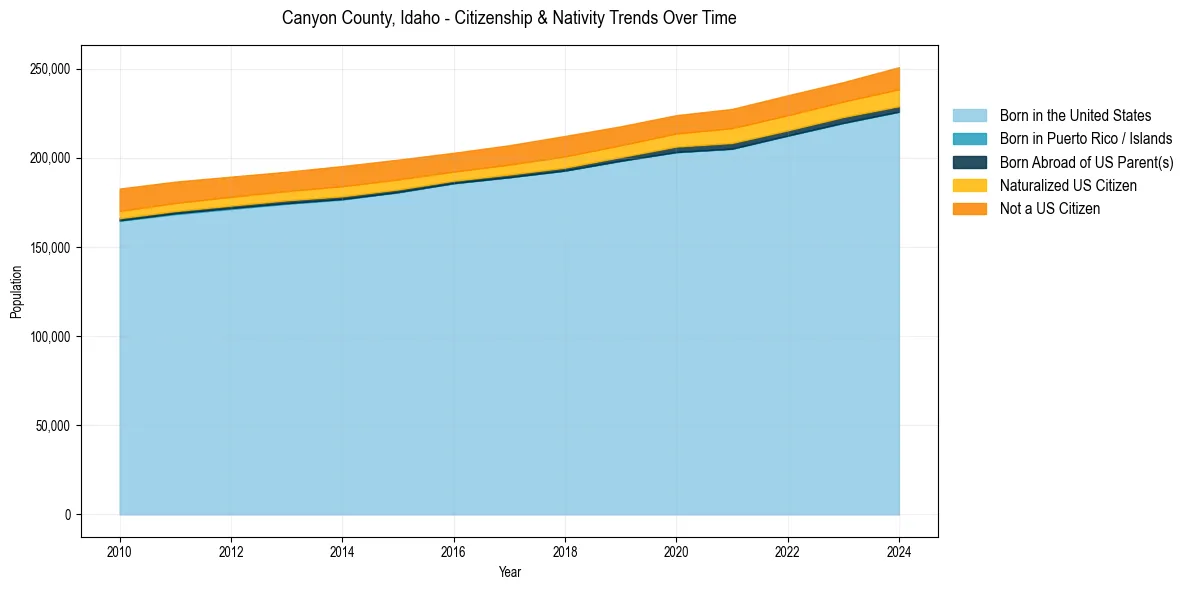
Canyon County, Idaho Population & Nativity History
| Year | Total Pop | Foreign Born | Native Born |
|---|---|---|---|
| 2024 | 250,790 | 8.7% | 91.3% |
| 2023 | 242,405 | 8.1% | 91.9% |
| 2022 | 235,006 | 8.4% | 91.6% |
| 2021 | 227,367 | 8.4% | 91.6% |
| 2020 | 223,890 | 7.9% | 92.1% |
| 2019 | 217,633 | 7.9% | 92.1% |
| 2018 | 212,230 | 8.4% | 91.6% |
| 2017 | 207,027 | 7.9% | 92.1% |
| 2016 | 202,782 | 7.7% | 92.3% |
| 2015 | 198,921 | 8.4% | 91.6% |
| 2014 | 195,353 | 8.7% | 91.3% |
| 2013 | 192,153 | 8.4% | 91.6% |
| 2012 | 189,396 | 8.6% | 91.4% |
| 2011 | 186,620 | 8.9% | 91.1% |
| 2010 | 182,723 | 9.1% | 90.9% |
Nativity & Citizenship FAQs for Canyon County, Idaho
Approximately 8.7% of residents in Canyon County, Idaho were born outside the United States.
The vast majority of residents, roughly 95.1%, are U.S. citizens (including both native-born and naturalized citizens).