Bonneville County, Idaho Nativity & Citizenship Status (2024)
Place of birth and citizenship status analysis for Bonneville County, Idaho
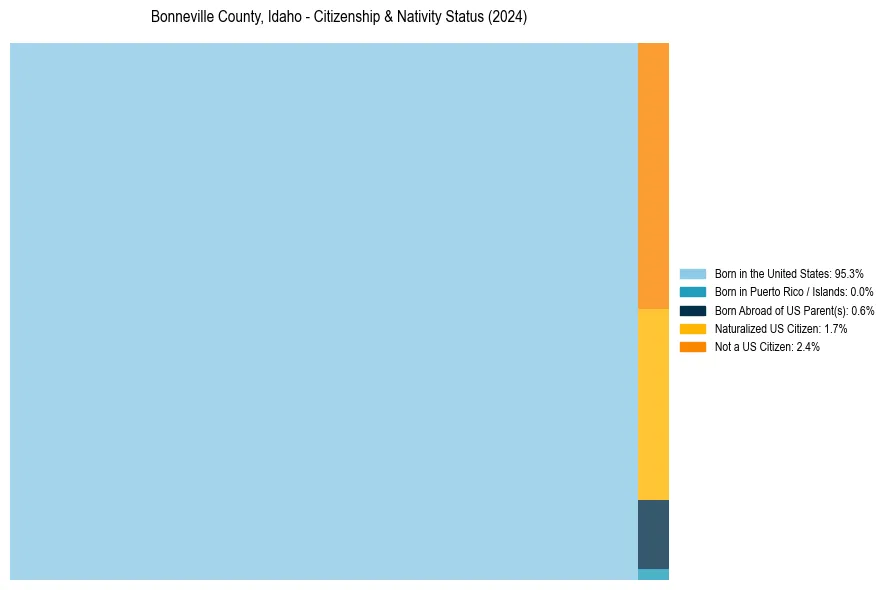
Bonneville County, Idaho Nativity & Citizenship Indicators (2024)
Native Born
95.9%
Foreign Born
4.1%
Naturalized
1.7%
US Citizens
97.6%
Bonneville County, Idaho Nativity & Citizenship Distribution
Bonneville County, Idaho Historical Nativity Trends (2010–2024)
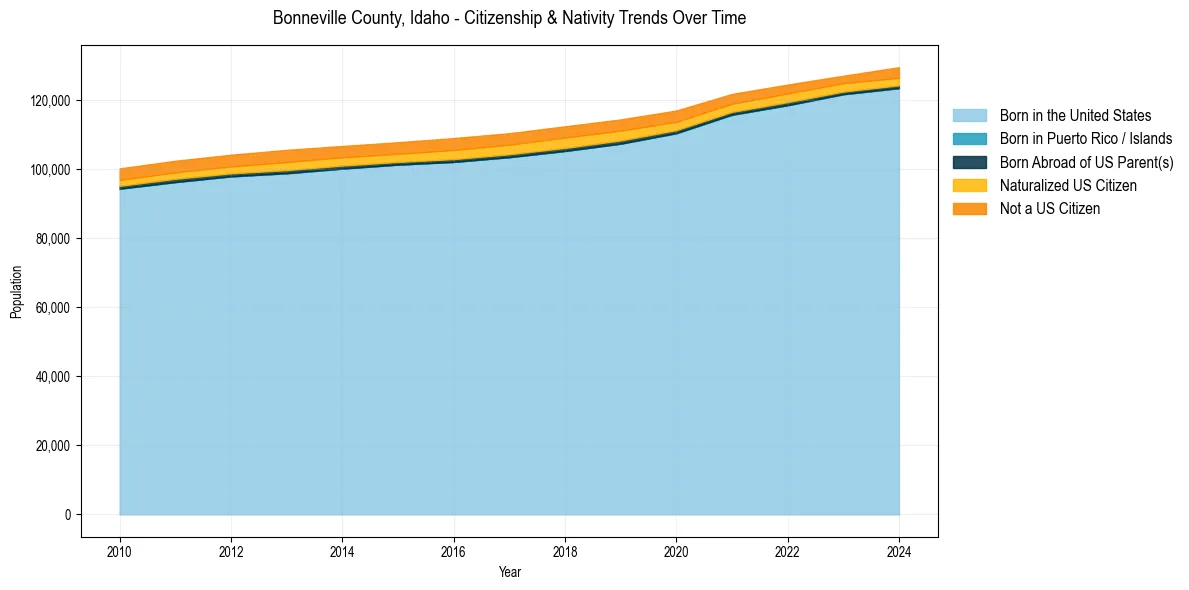
Bonneville County, Idaho Population & Nativity History
| Year | Total Pop | Foreign Born | Native Born |
|---|---|---|---|
| 2024 | 129,523 | 4.1% | 95.9% |
| 2023 | 127,056 | 3.6% | 96.4% |
| 2022 | 124,490 | 4.1% | 95.9% |
| 2021 | 121,771 | 4.3% | 95.7% |
| 2020 | 116,970 | 4.9% | 95.1% |
| 2019 | 114,392 | 5.3% | 94.7% |
| 2018 | 112,397 | 5.6% | 94.4% |
| 2017 | 110,404 | 5.5% | 94.5% |
| 2016 | 108,989 | 5.6% | 94.4% |
| 2015 | 107,788 | 5.3% | 94.7% |
| 2014 | 106,703 | 5.3% | 94.7% |
| 2013 | 105,580 | 5.6% | 94.4% |
| 2012 | 104,177 | 5.2% | 94.8% |
| 2011 | 102,422 | 5.1% | 94.9% |
| 2010 | 100,213 | 5.1% | 94.9% |
Nativity & Citizenship FAQs for Bonneville County, Idaho
Approximately 4.1% of residents in Bonneville County, Idaho were born outside the United States.
The vast majority of residents, roughly 97.6%, are U.S. citizens (including both native-born and naturalized citizens).