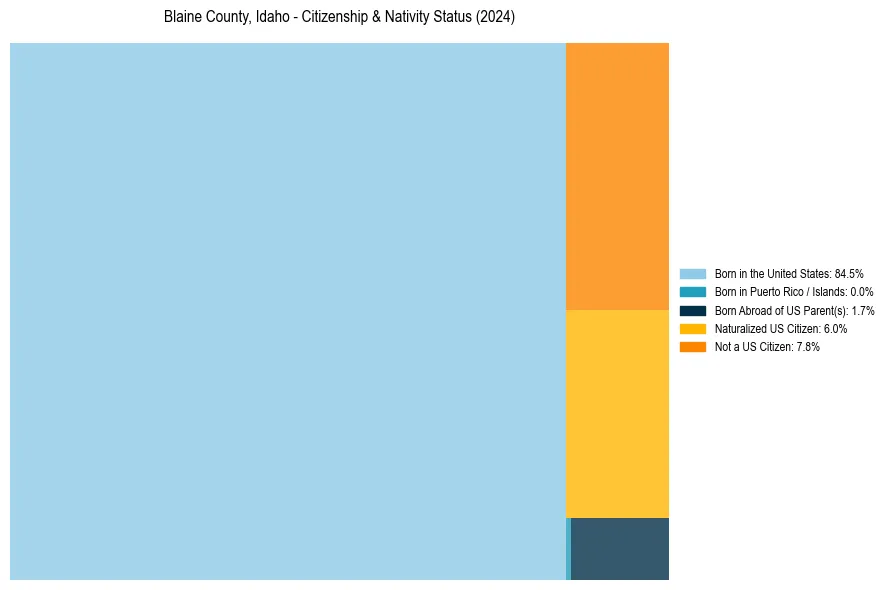
Blaine County, Idaho Nativity & Citizenship Status (2024)
Place of birth and citizenship status analysis for Blaine County, Idaho
Blaine County, Idaho Nativity & Citizenship Indicators (2024)
Native Born
86.2%
Foreign Born
13.8%
Naturalized
6.0%
US Citizens
92.2%
Blaine County, Idaho Nativity & Citizenship Distribution
Blaine County, Idaho Historical Nativity Trends (2010–2024)
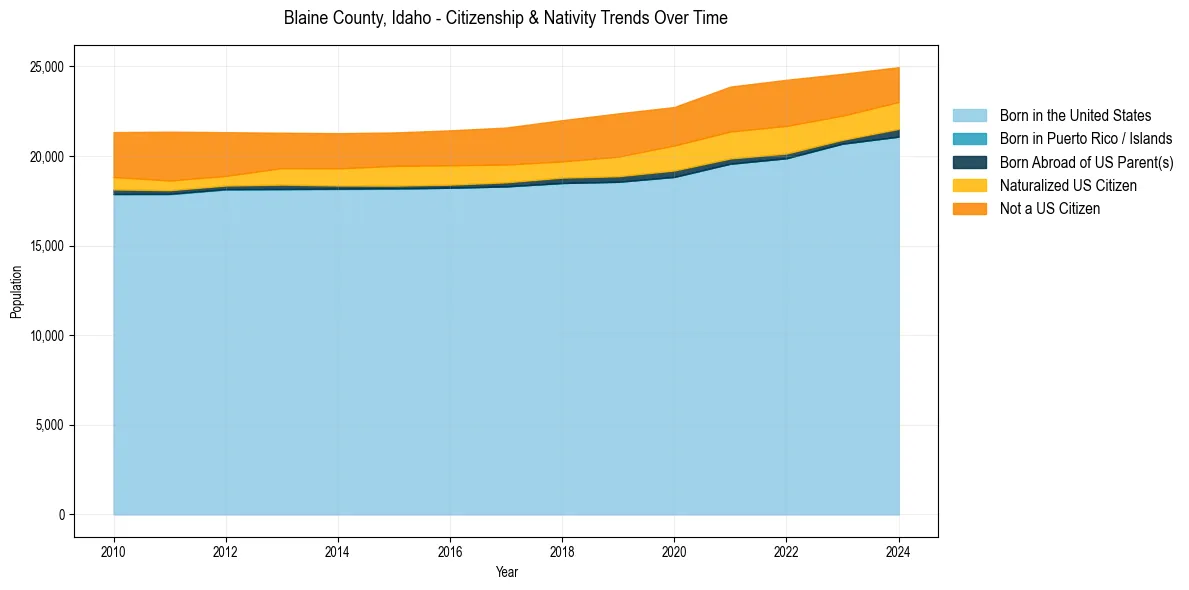
Blaine County, Idaho Population & Nativity History
| Year | Total Pop | Foreign Born | Native Born |
|---|---|---|---|
| 2024 | 24,951 | 13.8% | 86.2% |
| 2023 | 24,579 | 15.0% | 85.0% |
| 2022 | 24,248 | 17.0% | 83.0% |
| 2021 | 23,868 | 16.8% | 83.2% |
| 2020 | 22,729 | 15.6% | 84.4% |
| 2019 | 22,373 | 15.7% | 84.3% |
| 2018 | 21,994 | 14.6% | 85.4% |
| 2017 | 21,583 | 14.2% | 85.8% |
| 2016 | 21,427 | 14.1% | 85.9% |
| 2015 | 21,309 | 13.9% | 86.1% |
| 2014 | 21,269 | 13.7% | 86.3% |
| 2013 | 21,294 | 13.6% | 86.4% |
| 2012 | 21,323 | 14.0% | 86.0% |
| 2011 | 21,354 | 15.3% | 84.7% |
| 2010 | 21,329 | 15.0% | 85.0% |
Nativity & Citizenship FAQs for Blaine County, Idaho
Approximately 13.8% of residents in Blaine County, Idaho were born outside the United States.
The vast majority of residents, roughly 92.2%, are U.S. citizens (including both native-born and naturalized citizens).