Bingham County, Idaho Nativity & Citizenship Status (2024)
Place of birth and citizenship status analysis for Bingham County, Idaho
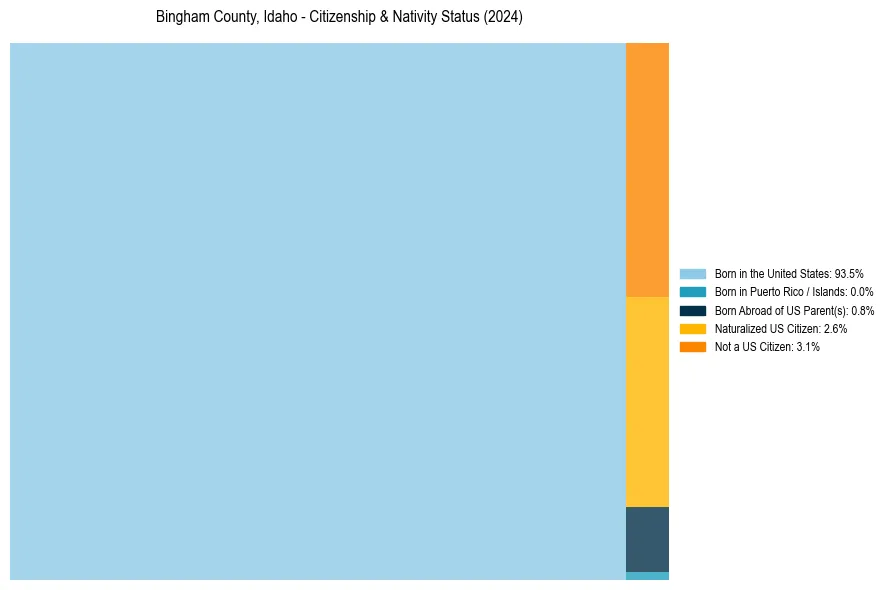
Bingham County, Idaho Nativity & Citizenship Indicators (2024)
Native Born
94.3%
Foreign Born
5.7%
Naturalized
2.6%
US Citizens
96.9%
Bingham County, Idaho Nativity & Citizenship Distribution
Bingham County, Idaho Historical Nativity Trends (2010–2024)
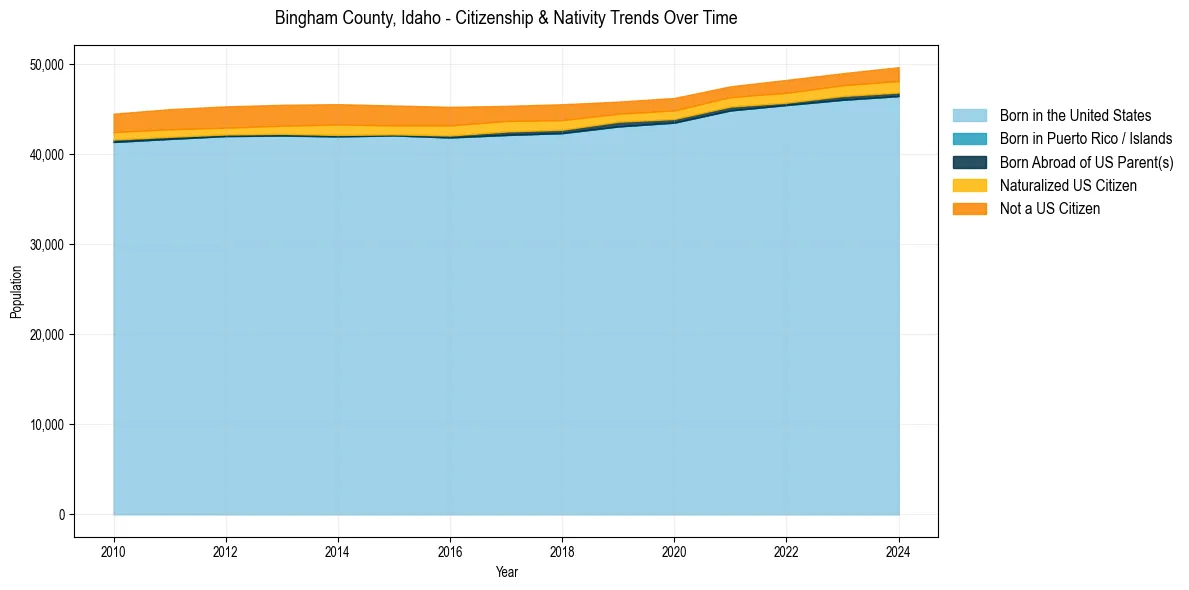
Bingham County, Idaho Population & Nativity History
| Year | Total Pop | Foreign Born | Native Born |
|---|---|---|---|
| 2024 | 49,664 | 5.7% | 94.3% |
| 2023 | 48,993 | 5.2% | 94.8% |
| 2022 | 48,253 | 5.2% | 94.8% |
| 2021 | 47,540 | 4.7% | 95.3% |
| 2020 | 46,246 | 5.0% | 95.0% |
| 2019 | 45,839 | 4.9% | 95.1% |
| 2018 | 45,551 | 6.2% | 93.8% |
| 2017 | 45,369 | 6.3% | 93.7% |
| 2016 | 45,261 | 7.0% | 93.0% |
| 2015 | 45,407 | 7.1% | 92.9% |
| 2014 | 45,558 | 7.5% | 92.5% |
| 2013 | 45,485 | 7.1% | 92.9% |
| 2012 | 45,312 | 6.9% | 93.1% |
| 2011 | 45,002 | 6.8% | 93.2% |
| 2010 | 44,496 | 6.4% | 93.6% |
Nativity & Citizenship FAQs for Bingham County, Idaho
Approximately 5.7% of residents in Bingham County, Idaho were born outside the United States.
The vast majority of residents, roughly 96.9%, are U.S. citizens (including both native-born and naturalized citizens).