Bannock County, Idaho Nativity & Citizenship Status (2024)
Place of birth and citizenship status analysis for Bannock County, Idaho
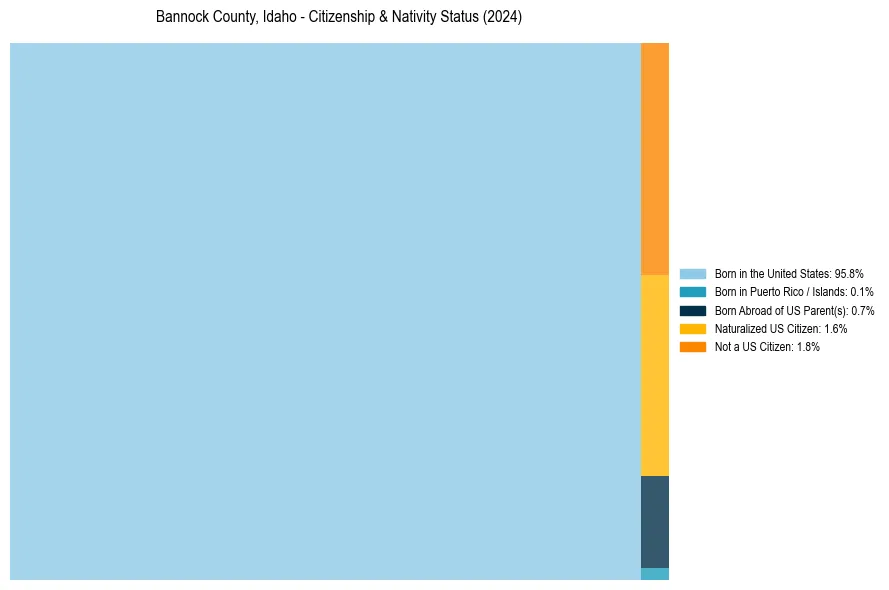
Bannock County, Idaho Nativity & Citizenship Indicators (2024)
Native Born
96.6%
Foreign Born
3.4%
Naturalized
1.6%
US Citizens
98.2%
Bannock County, Idaho Nativity & Citizenship Distribution
Bannock County, Idaho Historical Nativity Trends (2010–2024)
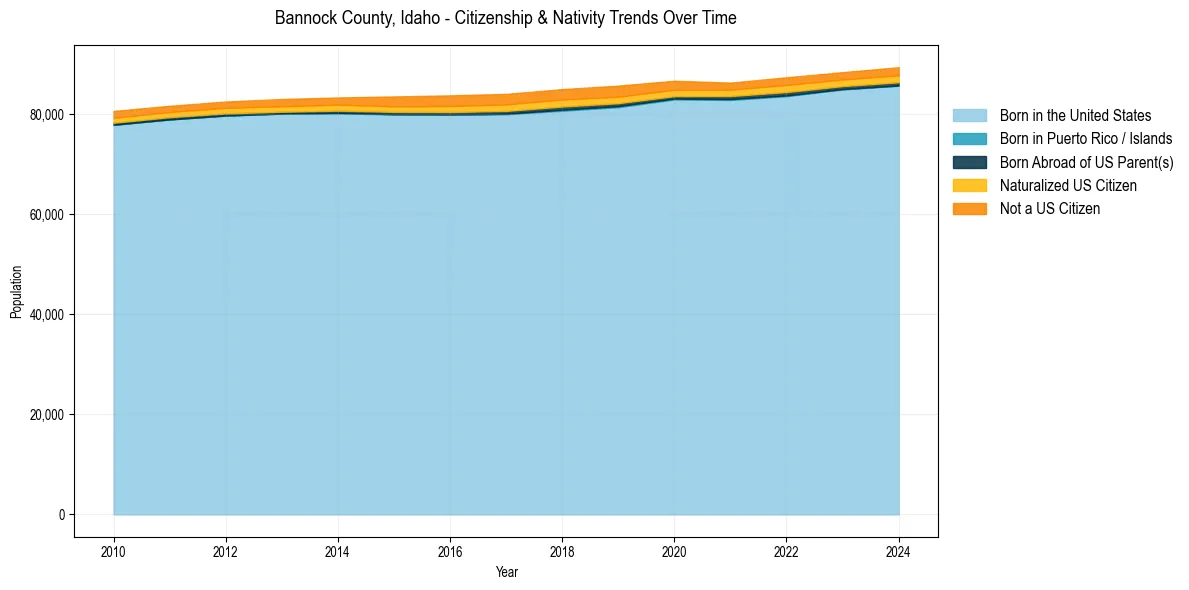
Bannock County, Idaho Population & Nativity History
| Year | Total Pop | Foreign Born | Native Born |
|---|---|---|---|
| 2024 | 89,454 | 3.4% | 96.6% |
| 2023 | 88,457 | 3.2% | 96.8% |
| 2022 | 87,434 | 3.4% | 96.6% |
| 2021 | 86,362 | 3.1% | 96.9% |
| 2020 | 86,742 | 3.6% | 96.4% |
| 2019 | 85,765 | 4.1% | 95.9% |
| 2018 | 85,065 | 4.1% | 95.9% |
| 2017 | 84,113 | 4.1% | 95.9% |
| 2016 | 83,815 | 4.0% | 96.0% |
| 2015 | 83,604 | 3.7% | 96.3% |
| 2014 | 83,394 | 3.2% | 96.8% |
| 2013 | 83,091 | 3.1% | 96.9% |
| 2012 | 82,584 | 2.9% | 97.1% |
| 2011 | 81,730 | 2.8% | 97.2% |
| 2010 | 80,701 | 2.9% | 97.1% |
Nativity & Citizenship FAQs for Bannock County, Idaho
Approximately 3.4% of residents in Bannock County, Idaho were born outside the United States.
The vast majority of residents, roughly 98.2%, are U.S. citizens (including both native-born and naturalized citizens).