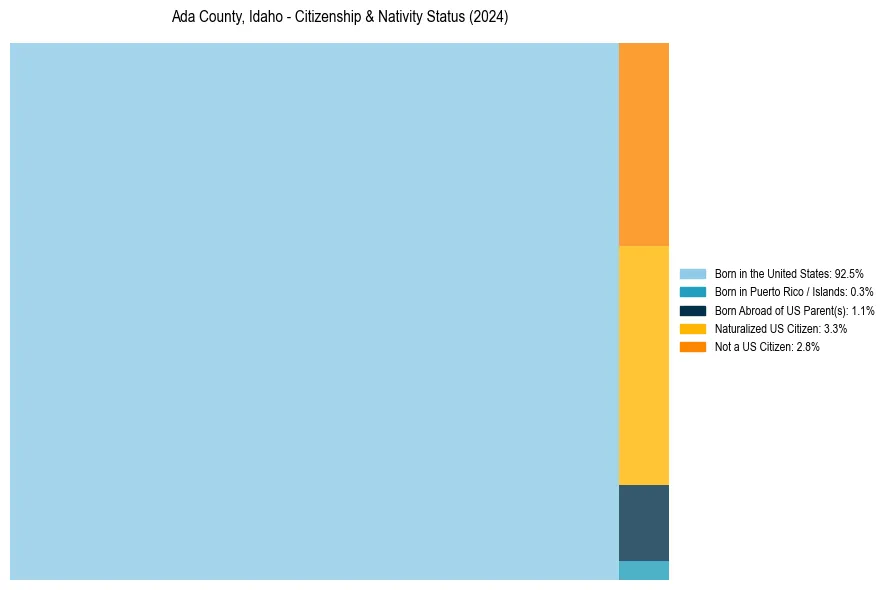
Ada County, Idaho Nativity & Citizenship Status (2024)
Place of birth and citizenship status analysis for Ada County, Idaho
Ada County, Idaho Nativity & Citizenship Indicators (2024)
Native Born
93.8%
Foreign Born
6.2%
Naturalized
3.3%
US Citizens
97.2%
Ada County, Idaho Nativity & Citizenship Distribution
Ada County, Idaho Historical Nativity Trends (2010–2024)
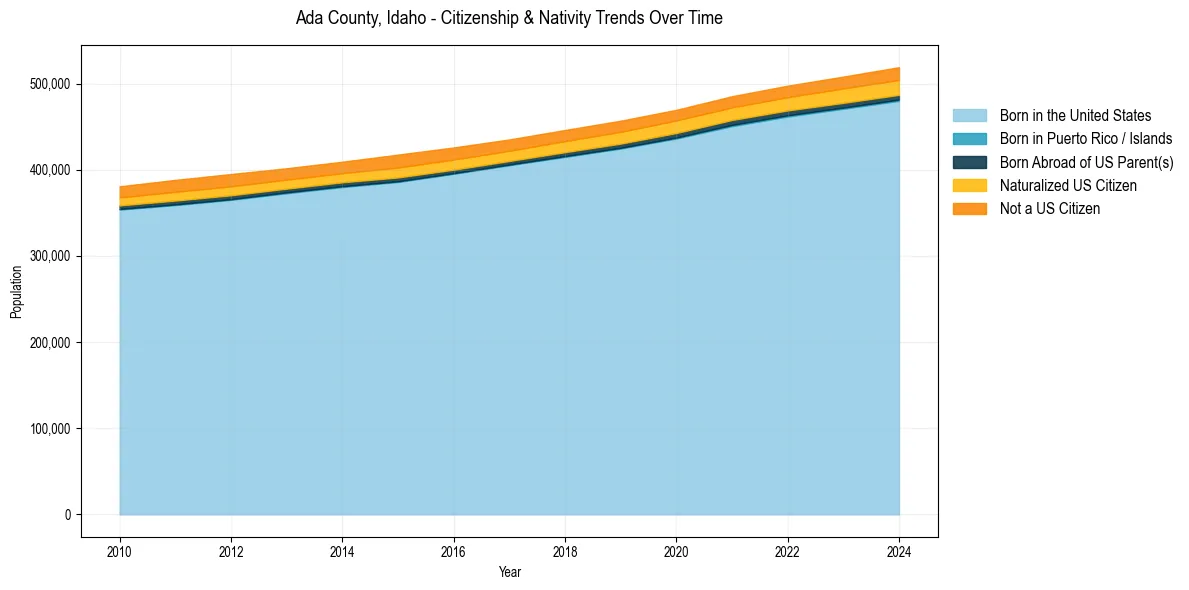
Ada County, Idaho Population & Nativity History
| Year | Total Pop | Foreign Born | Native Born |
|---|---|---|---|
| 2024 | 518,935 | 6.2% | 93.8% |
| 2023 | 508,052 | 6.0% | 94.0% |
| 2022 | 497,494 | 5.8% | 94.2% |
| 2021 | 485,246 | 5.7% | 94.3% |
| 2020 | 469,473 | 5.7% | 94.3% |
| 2019 | 456,849 | 5.8% | 94.2% |
| 2018 | 446,052 | 5.8% | 94.2% |
| 2017 | 435,117 | 5.8% | 94.2% |
| 2016 | 425,798 | 6.1% | 93.9% |
| 2015 | 417,501 | 6.4% | 93.6% |
| 2014 | 409,239 | 5.8% | 94.2% |
| 2013 | 401,673 | 5.9% | 94.1% |
| 2012 | 394,961 | 6.3% | 93.7% |
| 2011 | 388,174 | 6.2% | 93.8% |
| 2010 | 380,718 | 5.8% | 94.2% |
Nativity & Citizenship FAQs for Ada County, Idaho
Approximately 6.2% of residents in Ada County, Idaho were born outside the United States.
The vast majority of residents, roughly 97.2%, are U.S. citizens (including both native-born and naturalized citizens).