Troup County, Georgia Nativity & Citizenship Status (2024)
Place of birth and citizenship status analysis for Troup County, Georgia
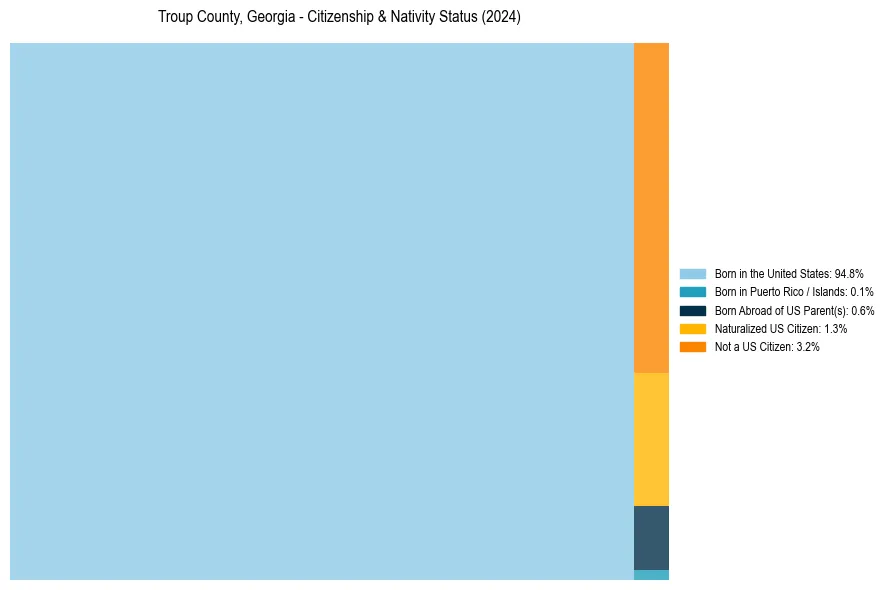
Troup County, Georgia Nativity & Citizenship Indicators (2024)
Native Born
95.5%
Foreign Born
4.5%
Naturalized
1.3%
US Citizens
96.8%
Troup County, Georgia Nativity & Citizenship Distribution
Troup County, Georgia Historical Nativity Trends (2010–2024)
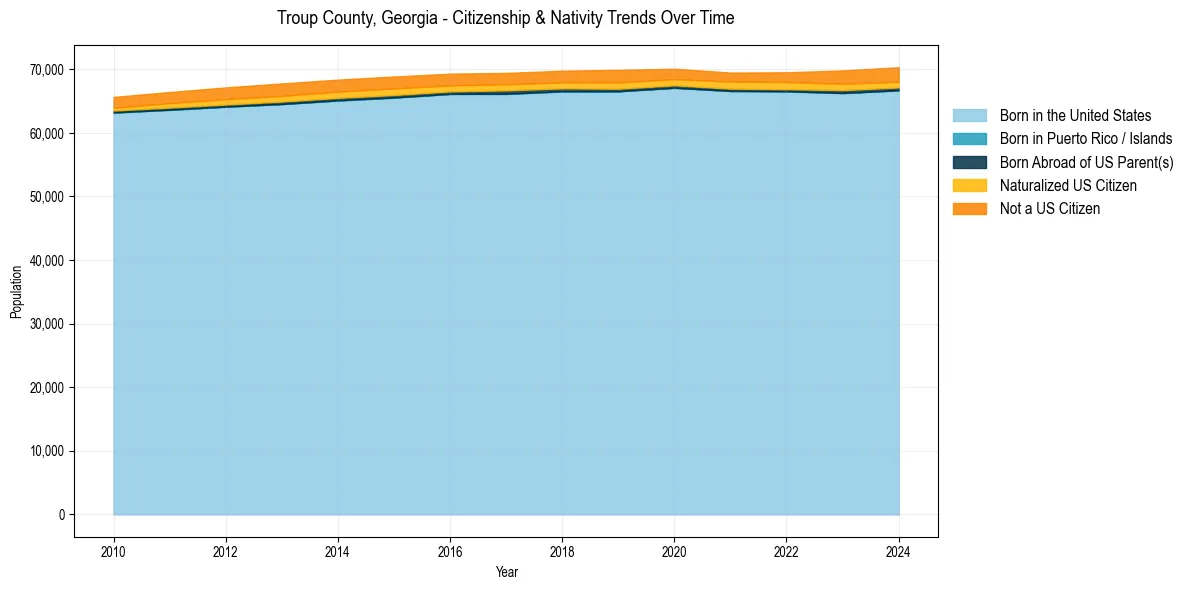
Troup County, Georgia Population & Nativity History
| Year | Total Pop | Foreign Born | Native Born |
|---|---|---|---|
| 2024 | 70,330 | 4.5% | 95.5% |
| 2023 | 69,821 | 4.4% | 95.6% |
| 2022 | 69,527 | 3.8% | 96.2% |
| 2021 | 69,483 | 3.6% | 96.4% |
| 2020 | 70,095 | 3.7% | 96.3% |
| 2019 | 69,919 | 4.3% | 95.7% |
| 2018 | 69,774 | 4.0% | 96.0% |
| 2017 | 69,433 | 4.0% | 96.0% |
| 2016 | 69,314 | 4.0% | 96.0% |
| 2015 | 68,867 | 4.2% | 95.8% |
| 2014 | 68,375 | 4.2% | 95.8% |
| 2013 | 67,776 | 4.2% | 95.8% |
| 2012 | 67,146 | 4.0% | 96.0% |
| 2011 | 66,422 | 3.7% | 96.3% |
| 2010 | 65,652 | 3.3% | 96.7% |
Nativity & Citizenship FAQs for Troup County, Georgia
Approximately 4.5% of residents in Troup County, Georgia were born outside the United States.
The vast majority of residents, roughly 96.8%, are U.S. citizens (including both native-born and naturalized citizens).