Oconee County, Georgia Nativity & Citizenship Status (2024)
Place of birth and citizenship status analysis for Oconee County, Georgia
Oconee County, Georgia Nativity & Citizenship Indicators (2024)
Native Born
92.9%
Foreign Born
7.1%
Naturalized
4.2%
US Citizens
97.1%
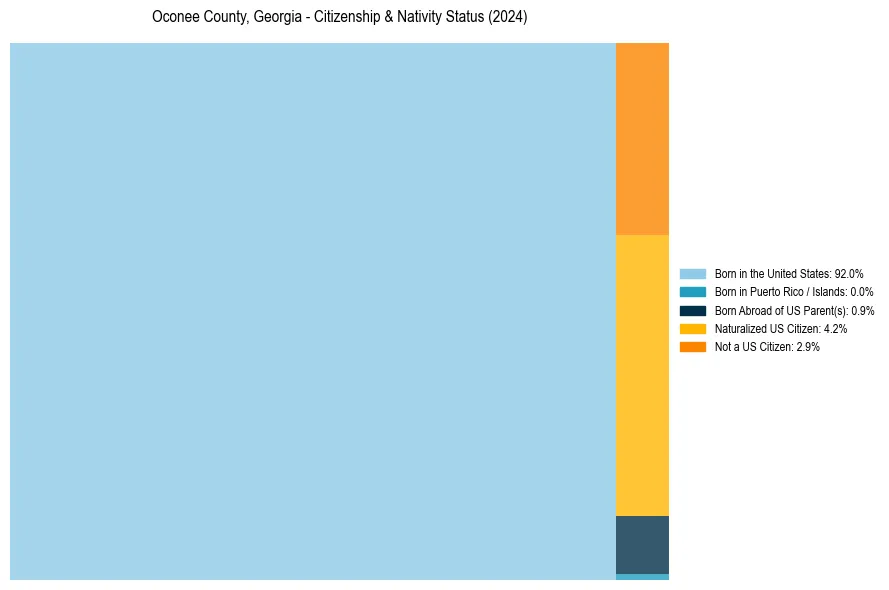
Oconee County, Georgia Nativity & Citizenship Distribution
Oconee County, Georgia Historical Nativity Trends (2010–2024)
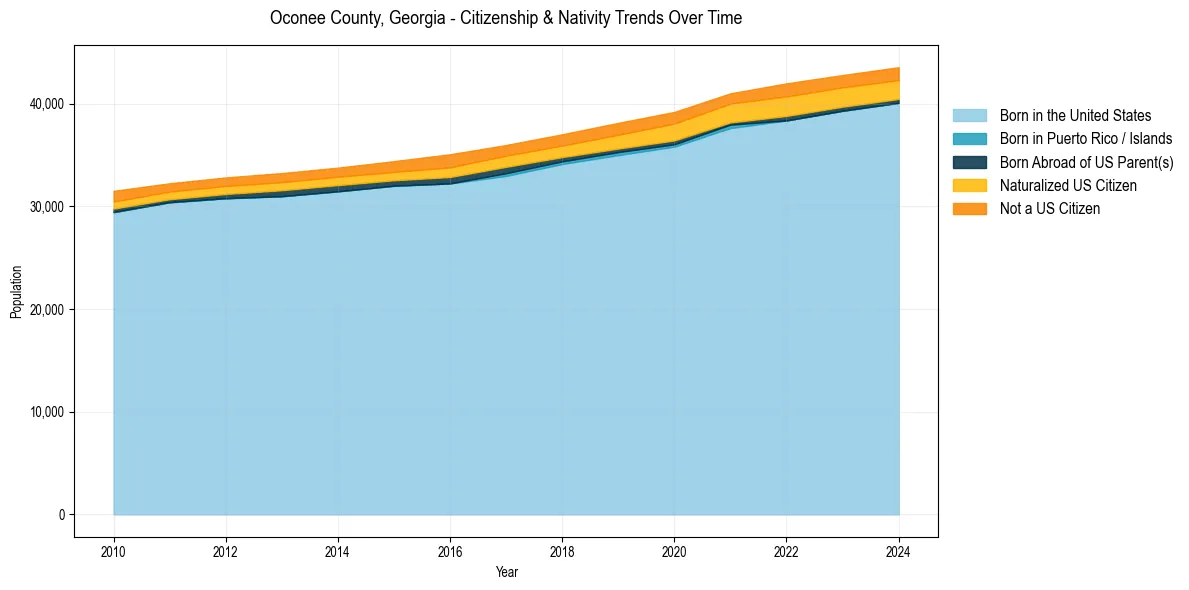
Oconee County, Georgia Population & Nativity History
| Year | Total Pop | Foreign Born | Native Born |
|---|---|---|---|
| 2024 | 43,551 | 7.1% | 92.9% |
| 2023 | 42,788 | 7.2% | 92.8% |
| 2022 | 41,978 | 7.6% | 92.4% |
| 2021 | 41,006 | 6.9% | 93.1% |
| 2020 | 39,194 | 7.1% | 92.9% |
| 2019 | 38,132 | 6.6% | 93.4% |
| 2018 | 37,017 | 6.0% | 94.0% |
| 2017 | 35,972 | 5.9% | 94.1% |
| 2016 | 35,071 | 6.3% | 93.7% |
| 2015 | 34,400 | 5.4% | 94.6% |
| 2014 | 33,769 | 5.0% | 95.0% |
| 2013 | 33,240 | 5.0% | 95.0% |
| 2012 | 32,814 | 4.9% | 95.1% |
| 2011 | 32,246 | 4.8% | 95.2% |
| 2010 | 31,508 | 5.5% | 94.5% |
Nativity & Citizenship FAQs for Oconee County, Georgia
Approximately 7.1% of residents in Oconee County, Georgia were born outside the United States.
The vast majority of residents, roughly 97.1%, are U.S. citizens (including both native-born and naturalized citizens).