Muscogee County, Georgia Nativity & Citizenship Status (2024)
Place of birth and citizenship status analysis for Muscogee County, Georgia
Muscogee County, Georgia Nativity & Citizenship Indicators (2024)
Native Born
94.9%
Foreign Born
5.1%
Naturalized
2.9%
US Citizens
97.8%
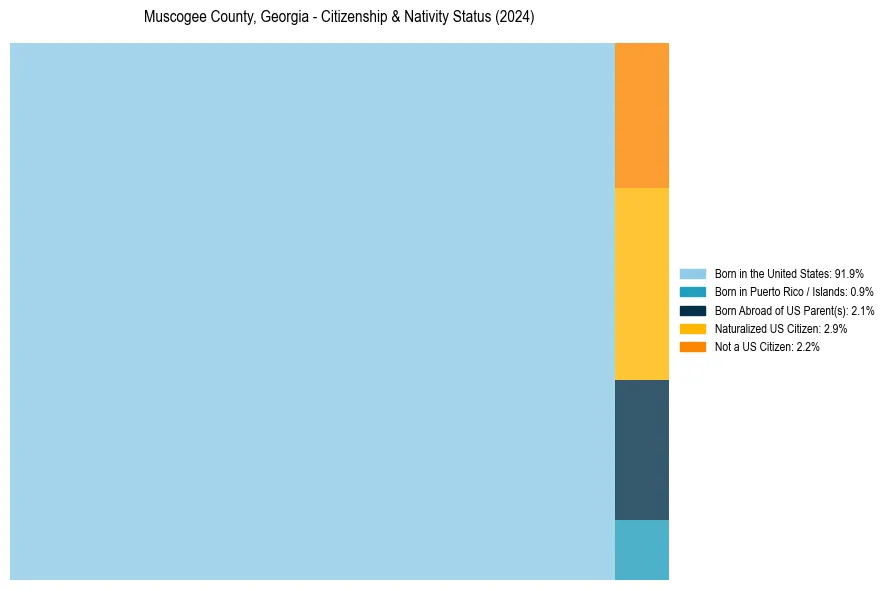
Muscogee County, Georgia Nativity & Citizenship Distribution
Muscogee County, Georgia Historical Nativity Trends (2010–2024)
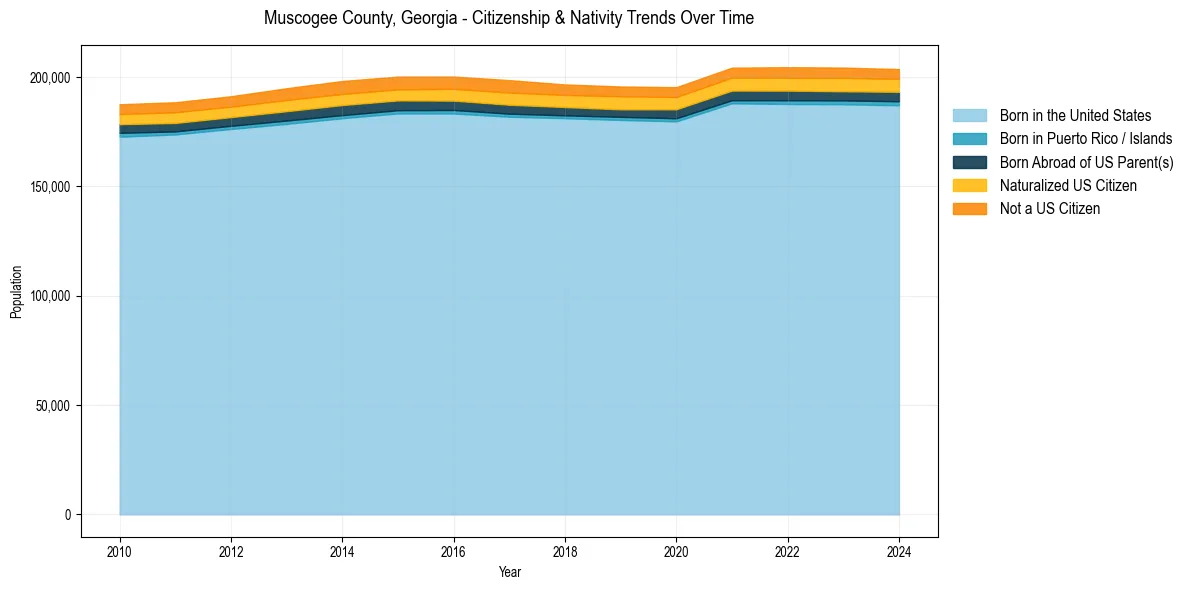
Muscogee County, Georgia Population & Nativity History
| Year | Total Pop | Foreign Born | Native Born |
|---|---|---|---|
| 2024 | 203,711 | 5.1% | 94.9% |
| 2023 | 204,383 | 5.3% | 94.7% |
| 2022 | 204,572 | 5.2% | 94.8% |
| 2021 | 204,366 | 5.1% | 94.9% |
| 2020 | 195,418 | 5.2% | 94.8% |
| 2019 | 195,739 | 5.3% | 94.7% |
| 2018 | 196,670 | 5.3% | 94.7% |
| 2017 | 198,647 | 5.7% | 94.3% |
| 2016 | 200,303 | 5.5% | 94.5% |
| 2015 | 200,285 | 5.4% | 94.6% |
| 2014 | 198,247 | 5.5% | 94.5% |
| 2013 | 194,949 | 5.4% | 94.6% |
| 2012 | 191,278 | 5.0% | 95.0% |
| 2011 | 188,548 | 5.0% | 95.0% |
| 2010 | 187,629 | 4.9% | 95.1% |
Nativity & Citizenship FAQs for Muscogee County, Georgia
Approximately 5.1% of residents in Muscogee County, Georgia were born outside the United States.
The vast majority of residents, roughly 97.8%, are U.S. citizens (including both native-born and naturalized citizens).