Harris County, Georgia Nativity & Citizenship Status (2024)
Place of birth and citizenship status analysis for Harris County, Georgia
Harris County, Georgia Nativity & Citizenship Indicators (2024)
Native Born
97.9%
Foreign Born
2.1%
Naturalized
1.6%
US Citizens
99.5%
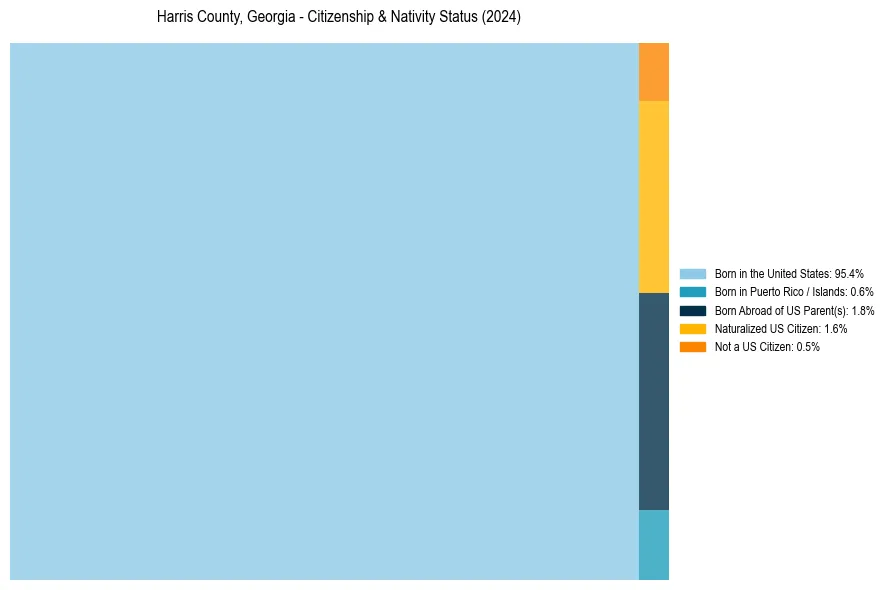
Harris County, Georgia Nativity & Citizenship Distribution
Harris County, Georgia Historical Nativity Trends (2010–2024)
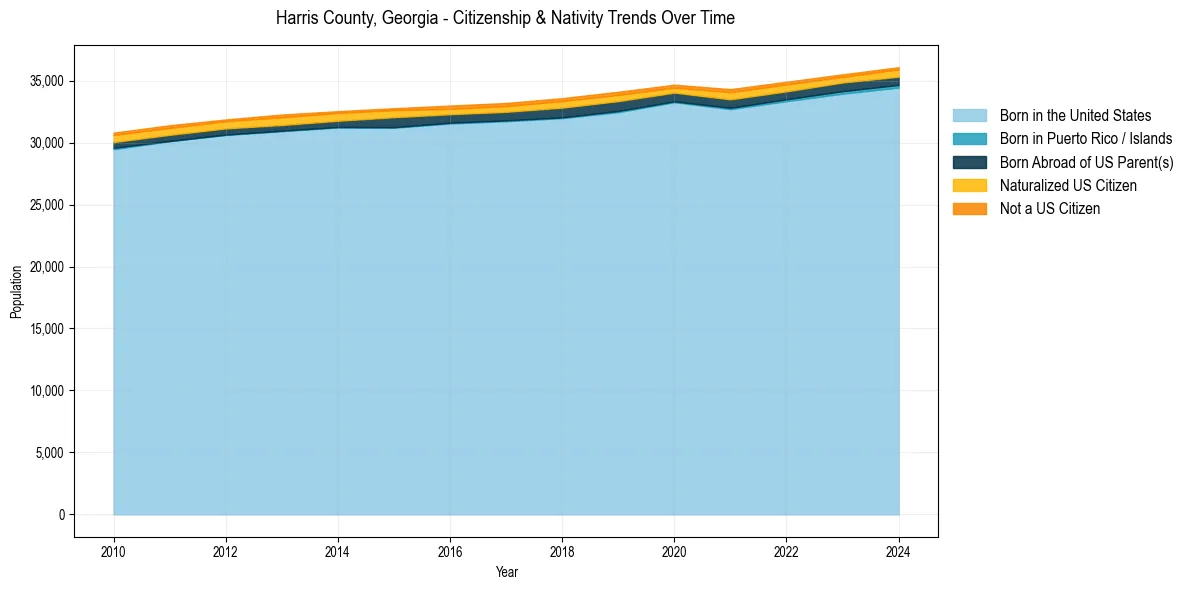
Harris County, Georgia Population & Nativity History
| Year | Total Pop | Foreign Born | Native Born |
|---|---|---|---|
| 2024 | 36,086 | 2.1% | 97.9% |
| 2023 | 35,509 | 1.9% | 98.1% |
| 2022 | 34,914 | 2.2% | 97.8% |
| 2021 | 34,316 | 2.4% | 97.6% |
| 2020 | 34,676 | 1.9% | 98.1% |
| 2019 | 34,105 | 2.2% | 97.8% |
| 2018 | 33,590 | 2.3% | 97.7% |
| 2017 | 33,198 | 2.2% | 97.8% |
| 2016 | 32,992 | 2.1% | 97.9% |
| 2015 | 32,776 | 2.2% | 97.8% |
| 2014 | 32,539 | 2.4% | 97.6% |
| 2013 | 32,267 | 2.6% | 97.4% |
| 2012 | 31,870 | 2.3% | 97.7% |
| 2011 | 31,401 | 2.5% | 97.5% |
| 2010 | 30,807 | 2.5% | 97.5% |
Nativity & Citizenship FAQs for Harris County, Georgia
Approximately 2.1% of residents in Harris County, Georgia were born outside the United States.
The vast majority of residents, roughly 99.5%, are U.S. citizens (including both native-born and naturalized citizens).