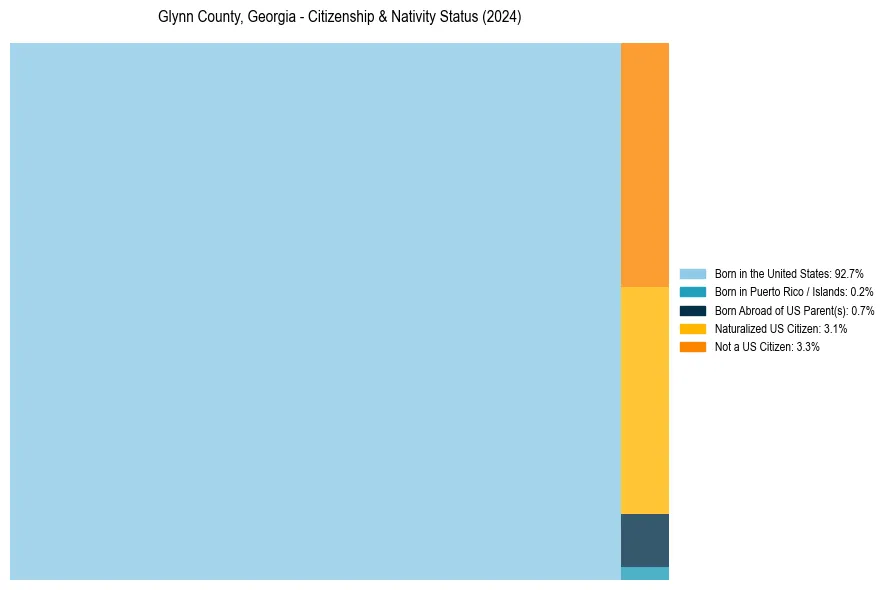
Glynn County, Georgia Nativity & Citizenship Status (2024)
Place of birth and citizenship status analysis for Glynn County, Georgia
Glynn County, Georgia Nativity & Citizenship Indicators (2024)
Native Born
93.6%
Foreign Born
6.4%
Naturalized
3.1%
US Citizens
96.7%
Glynn County, Georgia Nativity & Citizenship Distribution
Glynn County, Georgia Historical Nativity Trends (2010–2024)
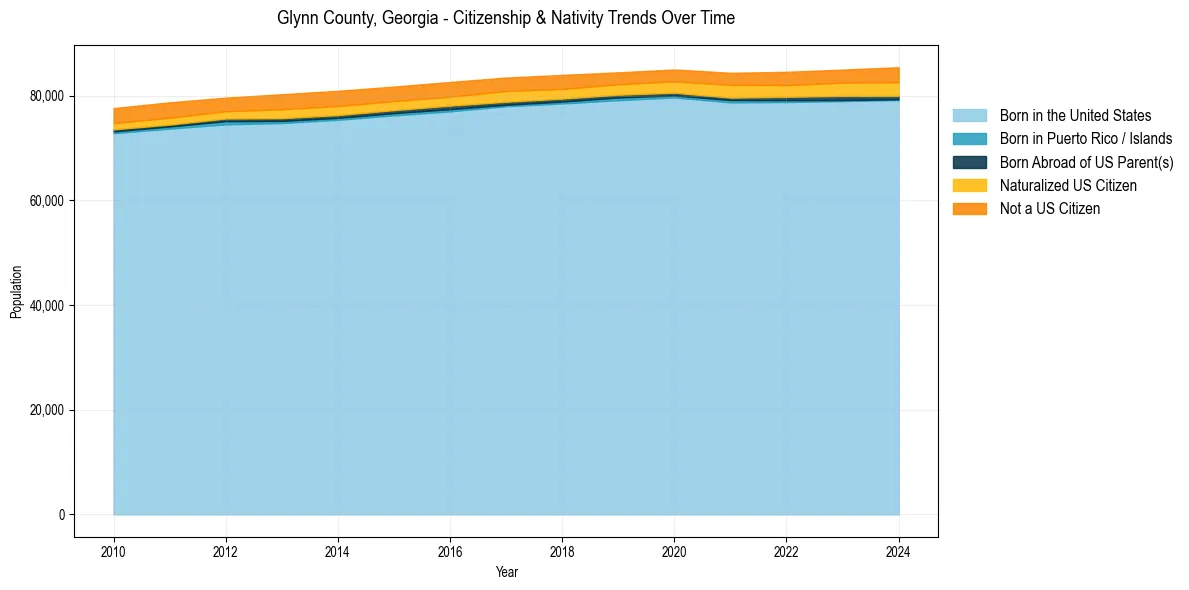
Glynn County, Georgia Population & Nativity History
| Year | Total Pop | Foreign Born | Native Born |
|---|---|---|---|
| 2024 | 85,447 | 6.4% | 93.6% |
| 2023 | 84,987 | 5.9% | 94.1% |
| 2022 | 84,566 | 5.7% | 94.3% |
| 2021 | 84,373 | 5.6% | 94.4% |
| 2020 | 85,008 | 5.2% | 94.8% |
| 2019 | 84,470 | 5.1% | 94.9% |
| 2018 | 83,974 | 5.4% | 94.6% |
| 2017 | 83,467 | 5.5% | 94.5% |
| 2016 | 82,623 | 5.5% | 94.5% |
| 2015 | 81,743 | 5.5% | 94.5% |
| 2014 | 80,937 | 5.7% | 94.3% |
| 2013 | 80,280 | 5.7% | 94.3% |
| 2012 | 79,628 | 5.0% | 95.0% |
| 2011 | 78,736 | 5.4% | 94.6% |
| 2010 | 77,632 | 5.2% | 94.8% |
Nativity & Citizenship FAQs for Glynn County, Georgia
Approximately 6.4% of residents in Glynn County, Georgia were born outside the United States.
The vast majority of residents, roughly 96.7%, are U.S. citizens (including both native-born and naturalized citizens).