Fayette County, Georgia Nativity & Citizenship Status (2024)
Place of birth and citizenship status analysis for Fayette County, Georgia
Fayette County, Georgia Nativity & Citizenship Indicators (2024)
Native Born
89.0%
Foreign Born
11.0%
Naturalized
5.9%
US Citizens
94.8%
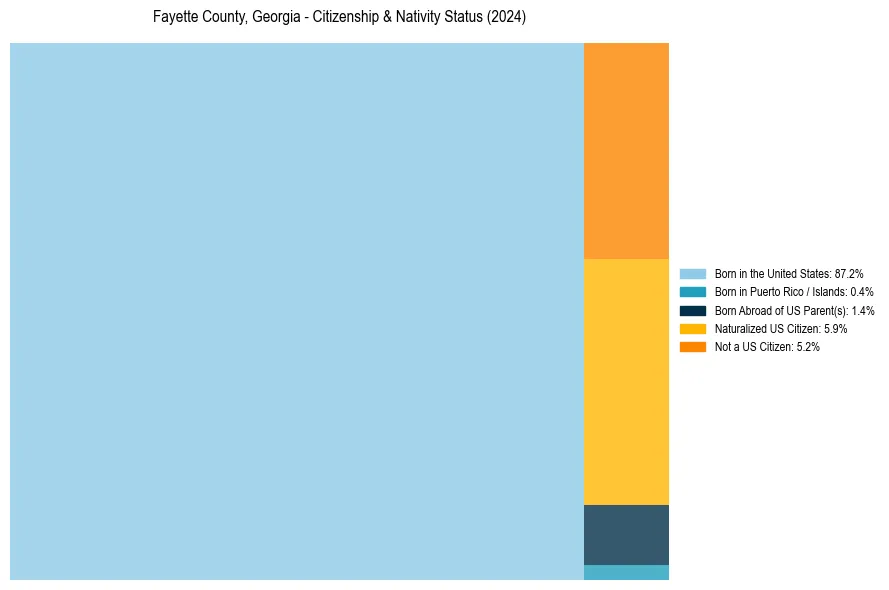
Fayette County, Georgia Nativity & Citizenship Distribution
Fayette County, Georgia Historical Nativity Trends (2010–2024)
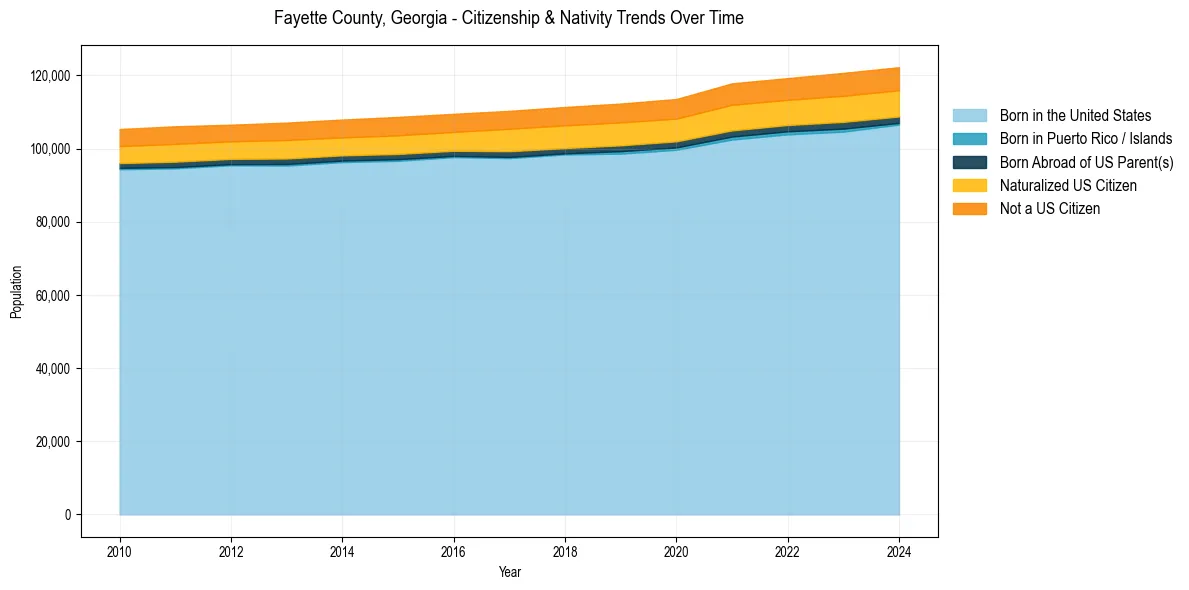
Fayette County, Georgia Population & Nativity History
| Year | Total Pop | Foreign Born | Native Born |
|---|---|---|---|
| 2024 | 122,244 | 11.0% | 89.0% |
| 2023 | 120,689 | 11.1% | 88.9% |
| 2022 | 119,259 | 10.8% | 89.2% |
| 2021 | 117,828 | 10.9% | 89.1% |
| 2020 | 113,544 | 10.2% | 89.8% |
| 2019 | 112,303 | 10.2% | 89.8% |
| 2018 | 111,369 | 10.1% | 89.9% |
| 2017 | 110,306 | 10.0% | 90.0% |
| 2016 | 109,495 | 9.2% | 90.8% |
| 2015 | 108,655 | 9.3% | 90.7% |
| 2014 | 107,930 | 9.1% | 90.9% |
| 2013 | 107,105 | 9.2% | 90.8% |
| 2012 | 106,525 | 8.8% | 91.2% |
| 2011 | 106,094 | 9.1% | 90.9% |
| 2010 | 105,344 | 8.8% | 91.2% |
Nativity & Citizenship FAQs for Fayette County, Georgia
Approximately 11.0% of residents in Fayette County, Georgia were born outside the United States.
The vast majority of residents, roughly 94.8%, are U.S. citizens (including both native-born and naturalized citizens).