Effingham County, Georgia Nativity & Citizenship Status (2024)
Place of birth and citizenship status analysis for Effingham County, Georgia
Effingham County, Georgia Nativity & Citizenship Indicators (2024)
Native Born
95.8%
Foreign Born
4.2%
Naturalized
1.9%
US Citizens
97.7%
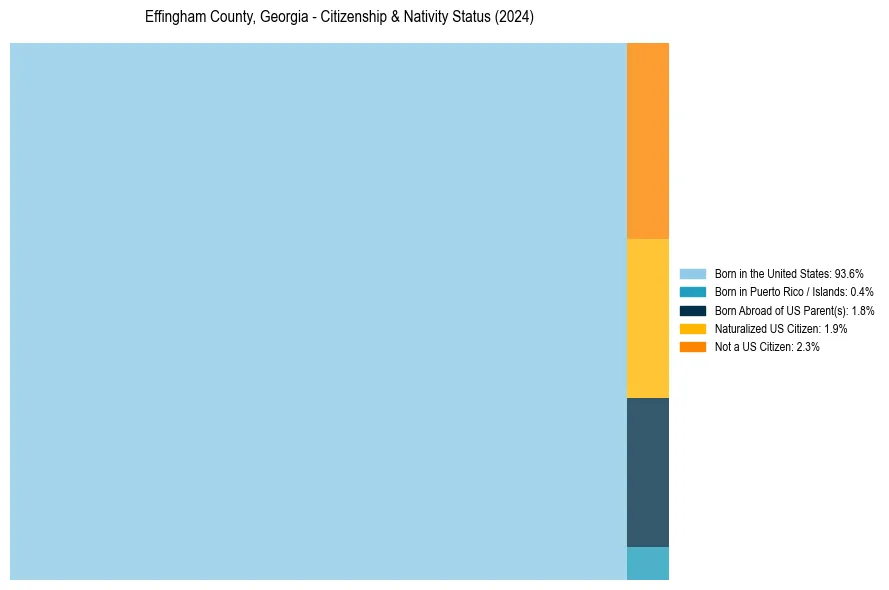
Effingham County, Georgia Nativity & Citizenship Distribution
Effingham County, Georgia Historical Nativity Trends (2010–2024)
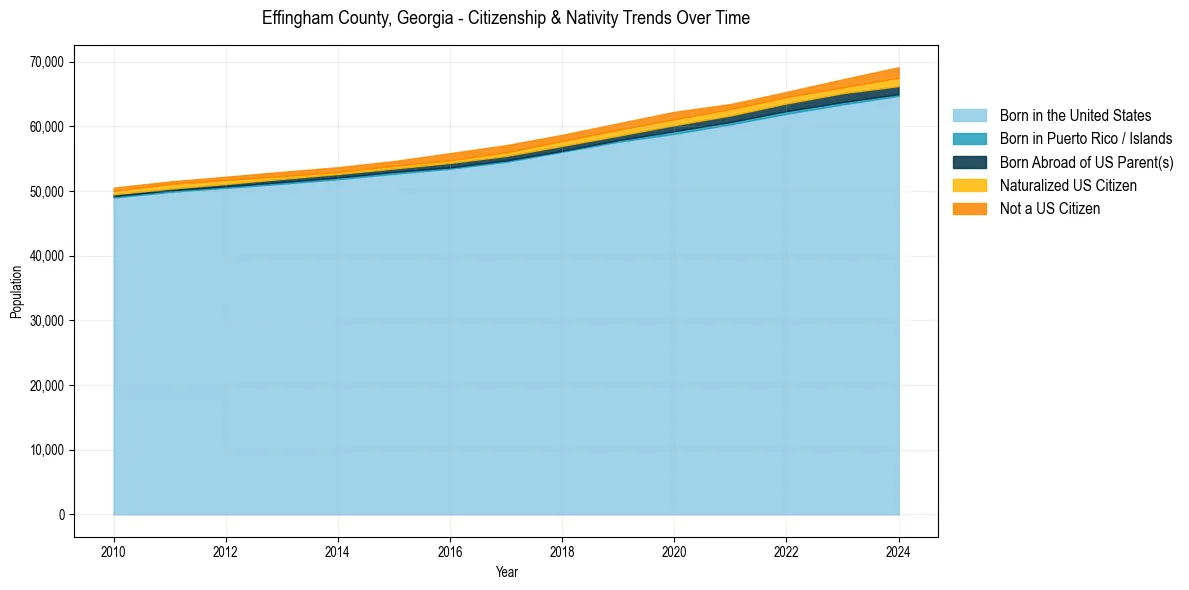
Effingham County, Georgia Population & Nativity History
| Year | Total Pop | Foreign Born | Native Born |
|---|---|---|---|
| 2024 | 69,143 | 4.2% | 95.8% |
| 2023 | 67,265 | 3.2% | 96.8% |
| 2022 | 65,314 | 2.7% | 97.3% |
| 2021 | 63,448 | 2.8% | 97.2% |
| 2020 | 62,241 | 3.3% | 96.7% |
| 2019 | 60,477 | 3.2% | 96.8% |
| 2018 | 58,689 | 2.9% | 97.1% |
| 2017 | 57,087 | 2.9% | 97.1% |
| 2016 | 55,852 | 2.7% | 97.3% |
| 2015 | 54,630 | 2.1% | 97.9% |
| 2014 | 53,673 | 2.0% | 98.0% |
| 2013 | 52,961 | 2.1% | 97.9% |
| 2012 | 52,203 | 2.2% | 97.8% |
| 2011 | 51,476 | 2.2% | 97.8% |
| 2010 | 50,513 | 2.0% | 98.0% |
Nativity & Citizenship FAQs for Effingham County, Georgia
Approximately 4.2% of residents in Effingham County, Georgia were born outside the United States.
The vast majority of residents, roughly 97.7%, are U.S. citizens (including both native-born and naturalized citizens).