Coweta County, Georgia Nativity & Citizenship Status (2024)
Place of birth and citizenship status analysis for Coweta County, Georgia
Coweta County, Georgia Nativity & Citizenship Indicators (2024)
Native Born
93.4%
Foreign Born
6.6%
Naturalized
3.0%
US Citizens
96.4%
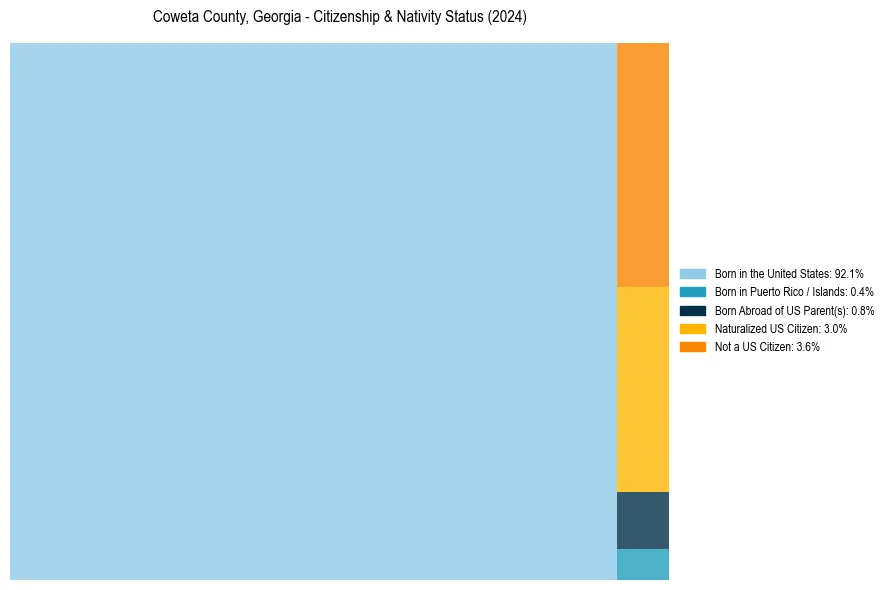
Coweta County, Georgia Nativity & Citizenship Distribution
Coweta County, Georgia Historical Nativity Trends (2010–2024)
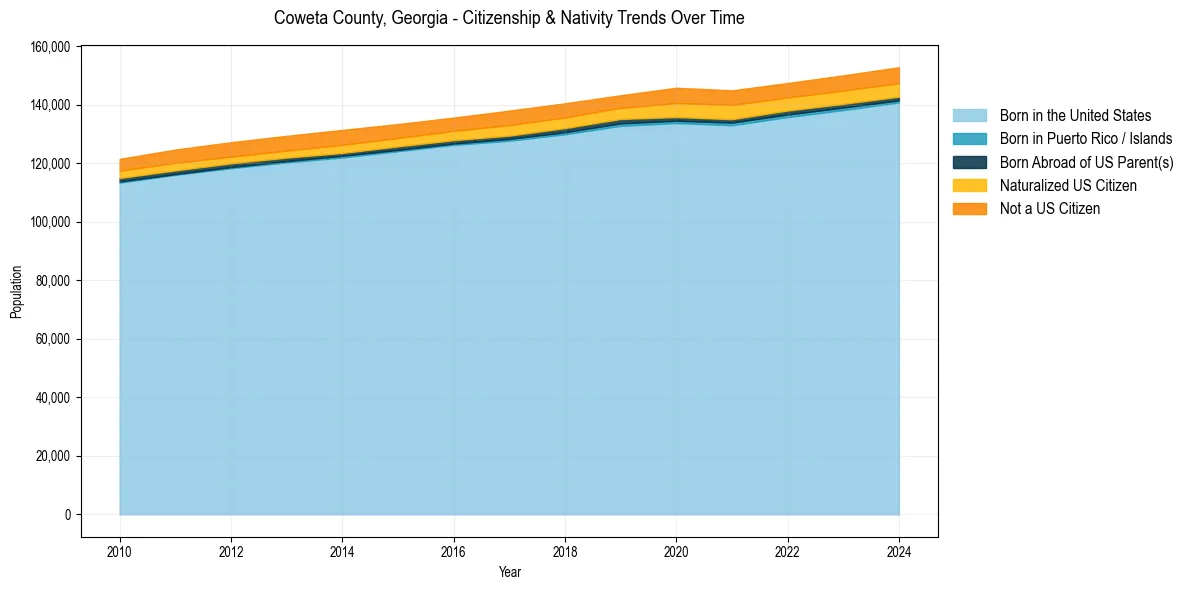
Coweta County, Georgia Population & Nativity History
| Year | Total Pop | Foreign Born | Native Born |
|---|---|---|---|
| 2024 | 152,852 | 6.6% | 93.4% |
| 2023 | 150,071 | 6.5% | 93.5% |
| 2022 | 147,449 | 6.4% | 93.6% |
| 2021 | 144,928 | 6.8% | 93.2% |
| 2020 | 145,839 | 6.9% | 93.1% |
| 2019 | 143,260 | 5.7% | 94.3% |
| 2018 | 140,516 | 6.0% | 94.0% |
| 2017 | 138,015 | 6.2% | 93.8% |
| 2016 | 135,625 | 5.7% | 94.3% |
| 2015 | 133,416 | 5.7% | 94.3% |
| 2014 | 131,419 | 6.0% | 94.0% |
| 2013 | 129,397 | 5.8% | 94.2% |
| 2012 | 127,212 | 5.7% | 94.3% |
| 2011 | 124,695 | 5.7% | 94.3% |
| 2010 | 121,528 | 5.4% | 94.6% |
Nativity & Citizenship FAQs for Coweta County, Georgia
Approximately 6.6% of residents in Coweta County, Georgia were born outside the United States.
The vast majority of residents, roughly 96.4%, are U.S. citizens (including both native-born and naturalized citizens).