Clayton County, Georgia Nativity & Citizenship Status (2024)
Place of birth and citizenship status analysis for Clayton County, Georgia
Clayton County, Georgia Nativity & Citizenship Indicators (2024)
Native Born
86.6%
Foreign Born
13.4%
Naturalized
7.0%
US Citizens
93.6%
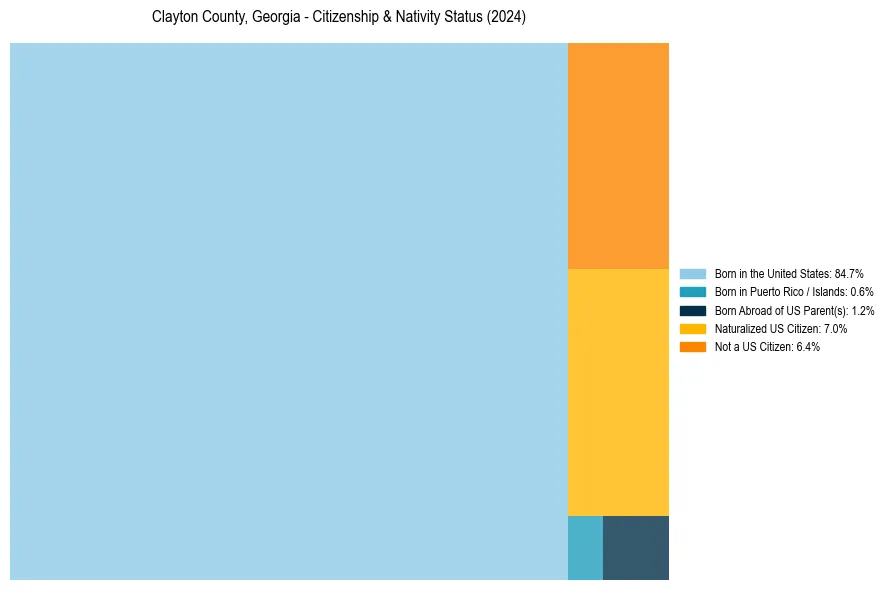
Clayton County, Georgia Nativity & Citizenship Distribution
Clayton County, Georgia Historical Nativity Trends (2010–2024)
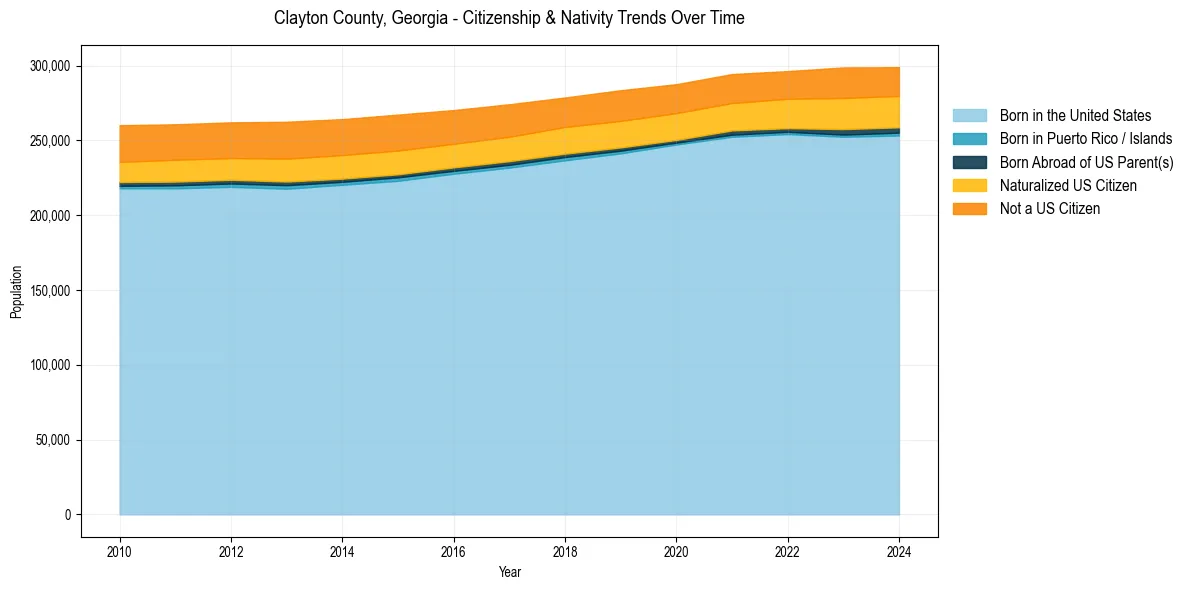
Clayton County, Georgia Population & Nativity History
| Year | Total Pop | Foreign Born | Native Born |
|---|---|---|---|
| 2024 | 298,924 | 13.4% | 86.6% |
| 2023 | 298,771 | 13.8% | 86.2% |
| 2022 | 296,312 | 12.9% | 87.1% |
| 2021 | 294,335 | 12.8% | 87.2% |
| 2020 | 287,560 | 13.0% | 87.0% |
| 2019 | 283,538 | 13.5% | 86.5% |
| 2018 | 278,666 | 13.5% | 86.5% |
| 2017 | 274,150 | 13.9% | 86.1% |
| 2016 | 270,269 | 14.2% | 85.8% |
| 2015 | 267,234 | 14.9% | 85.1% |
| 2014 | 264,221 | 15.1% | 84.9% |
| 2013 | 262,455 | 15.2% | 84.8% |
| 2012 | 262,066 | 14.7% | 85.3% |
| 2011 | 260,756 | 14.7% | 85.3% |
| 2010 | 260,156 | 14.6% | 85.4% |
Nativity & Citizenship FAQs for Clayton County, Georgia
Approximately 13.4% of residents in Clayton County, Georgia were born outside the United States.
The vast majority of residents, roughly 93.6%, are U.S. citizens (including both native-born and naturalized citizens).