Bulloch County, Georgia Nativity & Citizenship Status (2024)
Place of birth and citizenship status analysis for Bulloch County, Georgia
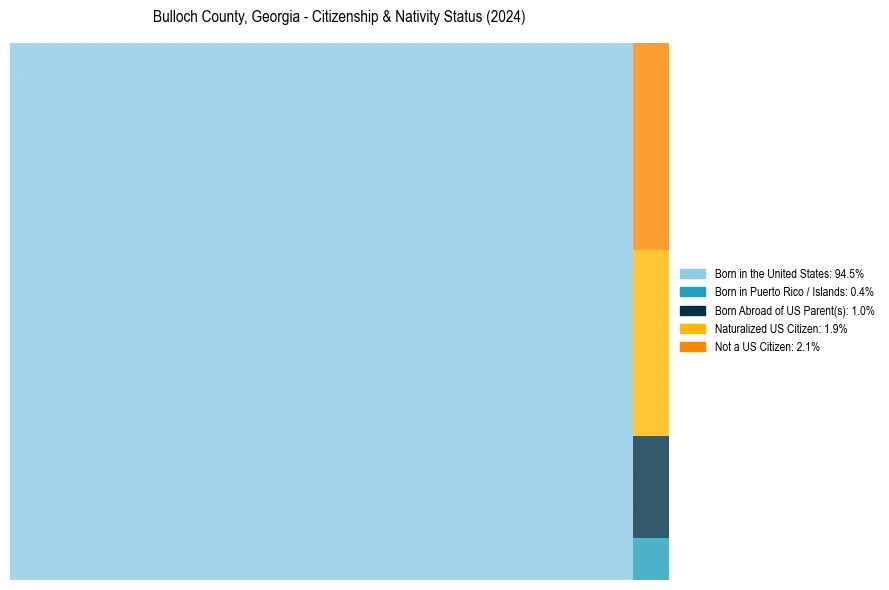
Bulloch County, Georgia Nativity & Citizenship Indicators (2024)
Native Born
96.0%
Foreign Born
4.0%
Naturalized
1.9%
US Citizens
97.9%
Bulloch County, Georgia Nativity & Citizenship Distribution
Bulloch County, Georgia Historical Nativity Trends (2010–2024)
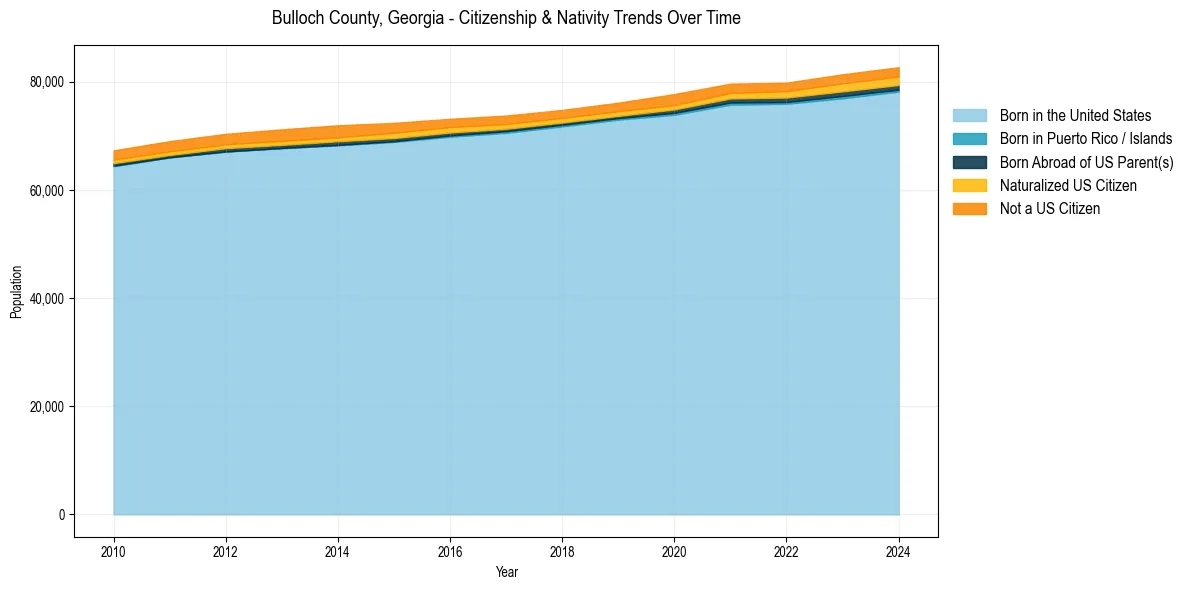
Bulloch County, Georgia Population & Nativity History
| Year | Total Pop | Foreign Born | Native Born |
|---|---|---|---|
| 2024 | 82,683 | 4.0% | 96.0% |
| 2023 | 81,372 | 3.9% | 96.1% |
| 2022 | 79,829 | 3.5% | 96.5% |
| 2021 | 79,635 | 3.4% | 96.6% |
| 2020 | 77,719 | 3.7% | 96.3% |
| 2019 | 76,120 | 3.2% | 96.8% |
| 2018 | 74,782 | 3.1% | 96.9% |
| 2017 | 73,742 | 3.3% | 96.7% |
| 2016 | 73,141 | 3.5% | 96.5% |
| 2015 | 72,386 | 3.9% | 96.1% |
| 2014 | 71,940 | 4.1% | 95.9% |
| 2013 | 71,190 | 4.0% | 96.0% |
| 2012 | 70,360 | 3.8% | 96.2% |
| 2011 | 69,008 | 3.7% | 96.3% |
| 2010 | 67,298 | 3.5% | 96.5% |
Nativity & Citizenship FAQs for Bulloch County, Georgia
Approximately 4.0% of residents in Bulloch County, Georgia were born outside the United States.
The vast majority of residents, roughly 97.9%, are U.S. citizens (including both native-born and naturalized citizens).