District of Columbia Nativity & Citizenship Status (2024)
Place of birth and citizenship status analysis for the District of Columbia
District of Columbia Nativity & Citizenship Indicators (2024)
Native Born
85.7%
Foreign Born
14.3%
Naturalized
6.9%
US Citizens
92.6%
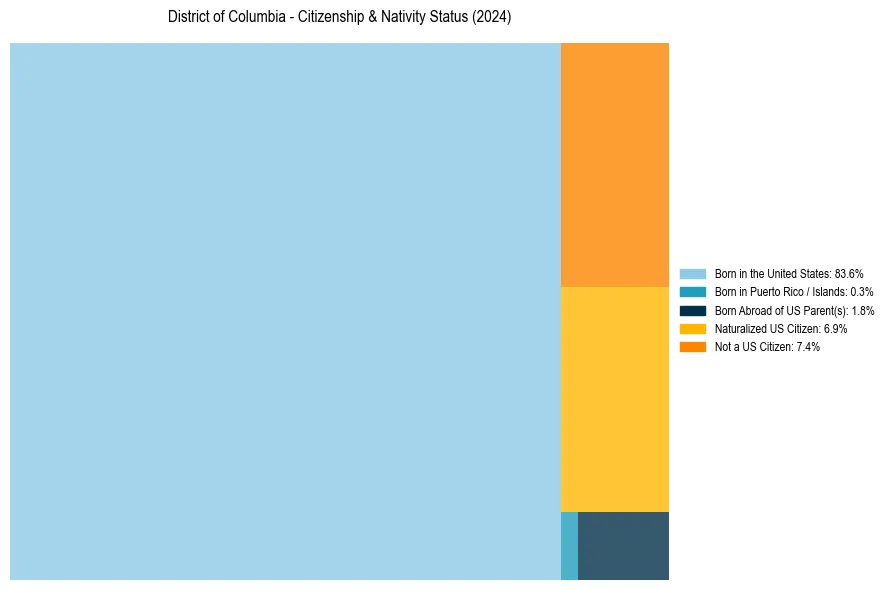
District of Columbia Nativity & Citizenship Distribution
District of Columbia Historical Nativity Trends (2010–2024)
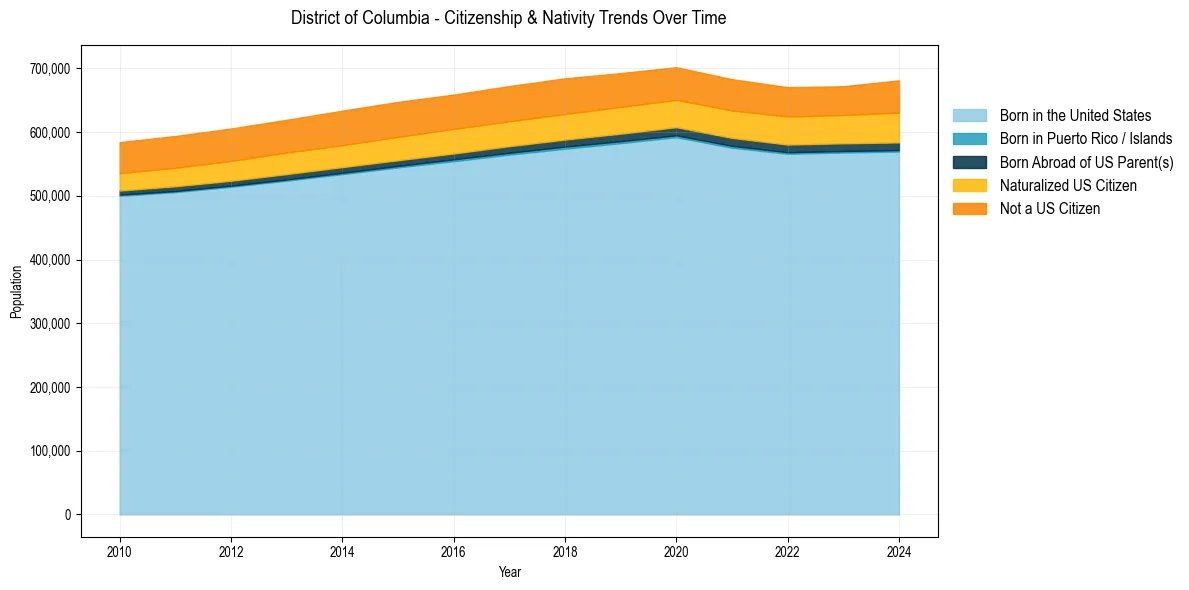
District of Columbia Population & Nativity History
| Year | Total Pop | Foreign Born | Native Born |
|---|---|---|---|
| 2024 | 681,294 | 14.3% | 85.7% |
| 2023 | 672,079 | 13.3% | 86.7% |
| 2022 | 670,587 | 13.4% | 86.6% |
| 2021 | 683,154 | 13.5% | 86.5% |
| 2020 | 701,974 | 13.4% | 86.6% |
| 2019 | 692,683 | 13.7% | 86.3% |
| 2018 | 684,498 | 14.0% | 86.0% |
| 2017 | 672,391 | 14.0% | 86.0% |
| 2016 | 659,009 | 14.0% | 86.0% |
| 2015 | 647,484 | 14.1% | 85.9% |
| 2014 | 633,736 | 14.0% | 86.0% |
| 2013 | 619,371 | 13.8% | 86.2% |
| 2012 | 605,759 | 13.5% | 86.5% |
| 2011 | 593,955 | 13.3% | 86.7% |
| 2010 | 584,400 | 13.0% | 87.0% |
Nativity & Citizenship FAQs for District of Columbia
Approximately 14.3% of residents in the District of Columbia were born outside the United States.
The vast majority of residents, roughly 92.6%, are U.S. citizens (including both native-born and naturalized citizens).