Sussex County, Delaware Nativity & Citizenship Status (2024)
Place of birth and citizenship status analysis for Sussex County, Delaware
Sussex County, Delaware Nativity & Citizenship Indicators (2024)
Native Born
91.6%
Foreign Born
8.4%
Naturalized
3.8%
US Citizens
95.5%
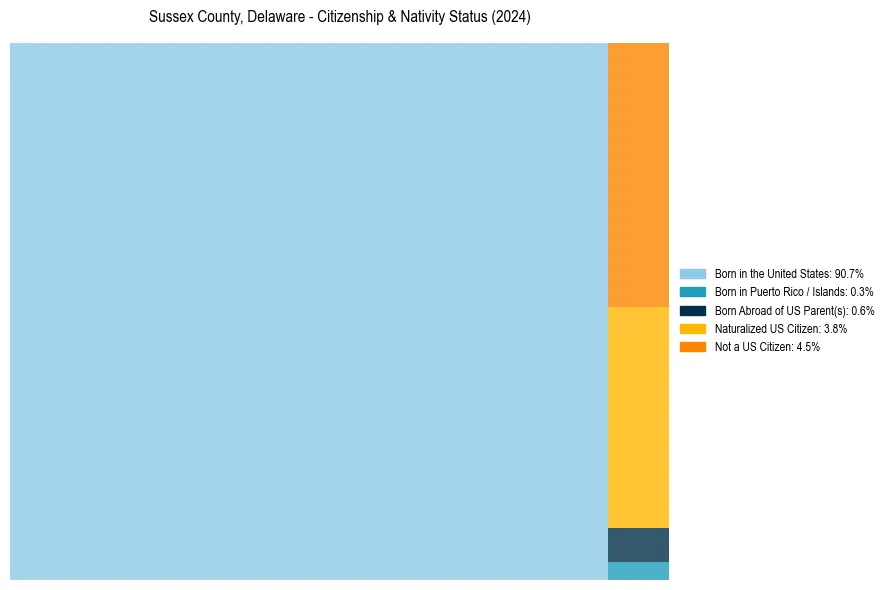
Sussex County, Delaware Nativity & Citizenship Distribution
Sussex County, Delaware Historical Nativity Trends (2010–2024)
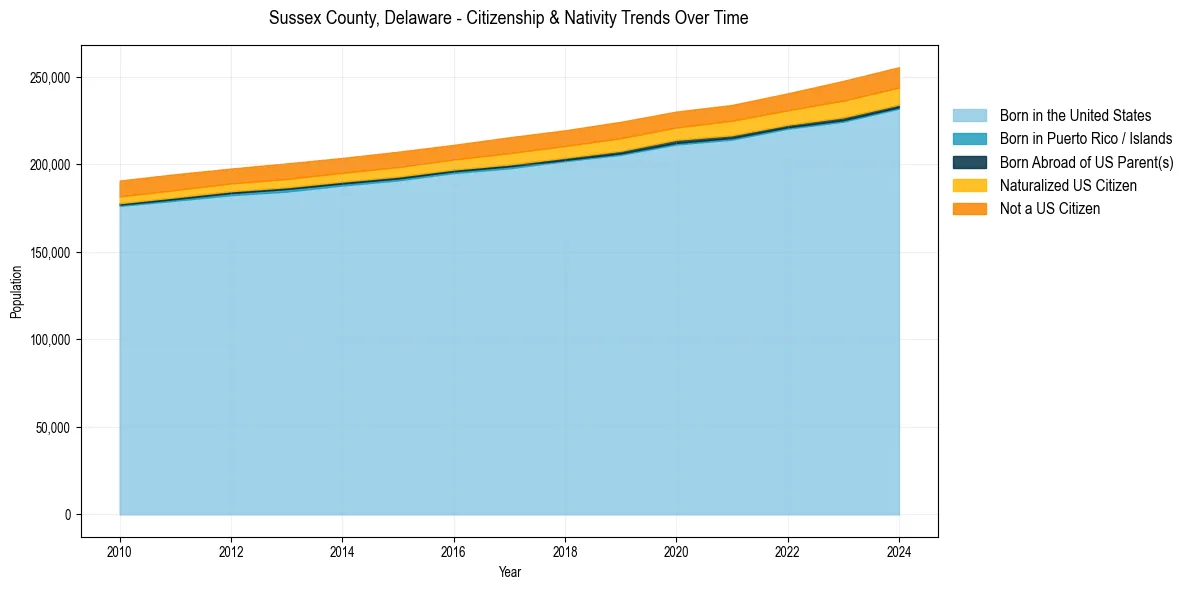
Sussex County, Delaware Population & Nativity History
| Year | Total Pop | Foreign Born | Native Born |
|---|---|---|---|
| 2024 | 255,626 | 8.4% | 91.6% |
| 2023 | 247,799 | 8.4% | 91.6% |
| 2022 | 240,668 | 7.5% | 92.5% |
| 2021 | 234,045 | 7.4% | 92.6% |
| 2020 | 230,249 | 7.0% | 93.0% |
| 2019 | 224,384 | 7.4% | 92.6% |
| 2018 | 219,540 | 7.1% | 92.9% |
| 2017 | 215,551 | 7.2% | 92.8% |
| 2016 | 211,224 | 6.7% | 93.3% |
| 2015 | 207,302 | 6.8% | 93.2% |
| 2014 | 203,737 | 6.6% | 93.4% |
| 2013 | 200,632 | 6.8% | 93.2% |
| 2012 | 197,681 | 6.6% | 93.4% |
| 2011 | 194,442 | 6.8% | 93.2% |
| 2010 | 190,846 | 6.8% | 93.2% |
Nativity & Citizenship FAQs for Sussex County, Delaware
Approximately 8.4% of residents in Sussex County, Delaware were born outside the United States.
The vast majority of residents, roughly 95.5%, are U.S. citizens (including both native-born and naturalized citizens).