New Castle County, Delaware Nativity & Citizenship Status (2024)
Place of birth and citizenship status analysis for New Castle County, Delaware
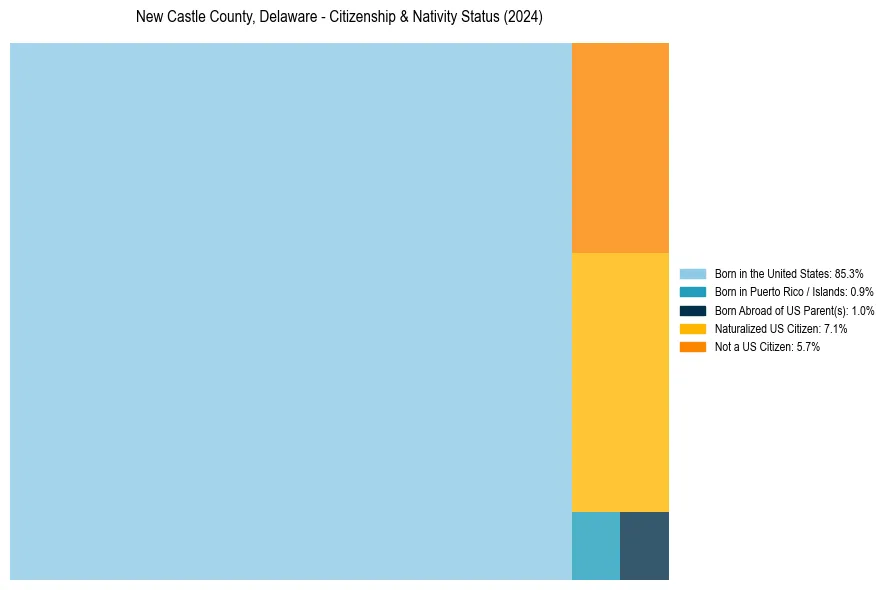
New Castle County, Delaware Nativity & Citizenship Indicators (2024)
Native Born
87.2%
Foreign Born
12.8%
Naturalized
7.1%
US Citizens
94.3%
New Castle County, Delaware Nativity & Citizenship Distribution
New Castle County, Delaware Historical Nativity Trends (2010–2024)
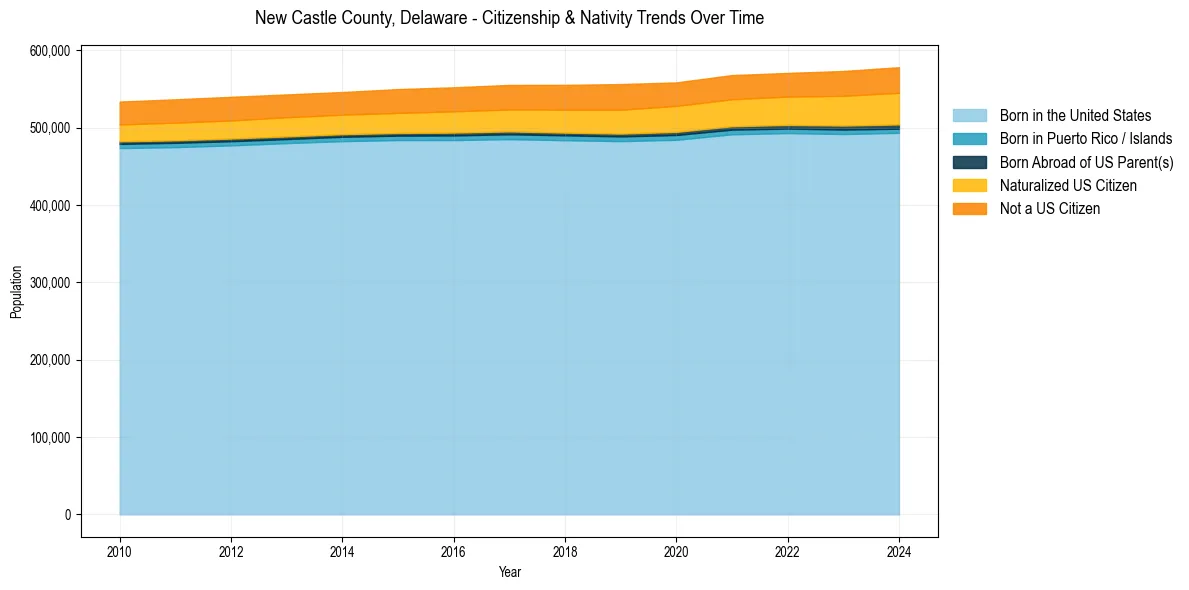
New Castle County, Delaware Population & Nativity History
| Year | Total Pop | Foreign Born | Native Born |
|---|---|---|---|
| 2024 | 577,961 | 12.8% | 87.2% |
| 2023 | 573,030 | 12.3% | 87.7% |
| 2022 | 570,567 | 11.8% | 88.2% |
| 2021 | 567,769 | 11.7% | 88.3% |
| 2020 | 558,306 | 11.5% | 88.5% |
| 2019 | 556,165 | 11.5% | 88.5% |
| 2018 | 555,133 | 11.1% | 88.9% |
| 2017 | 555,036 | 10.8% | 89.2% |
| 2016 | 551,997 | 10.6% | 89.4% |
| 2015 | 549,643 | 10.3% | 89.7% |
| 2014 | 545,846 | 10.0% | 90.0% |
| 2013 | 542,784 | 10.0% | 90.0% |
| 2012 | 539,665 | 10.0% | 90.0% |
| 2011 | 536,478 | 9.9% | 90.1% |
| 2010 | 533,514 | 9.6% | 90.4% |
Nativity & Citizenship FAQs for New Castle County, Delaware
Approximately 12.8% of residents in New Castle County, Delaware were born outside the United States.
The vast majority of residents, roughly 94.3%, are U.S. citizens (including both native-born and naturalized citizens).