Delaware Nativity & Citizenship Status (2024)
Place of birth and citizenship status analysis for Delaware
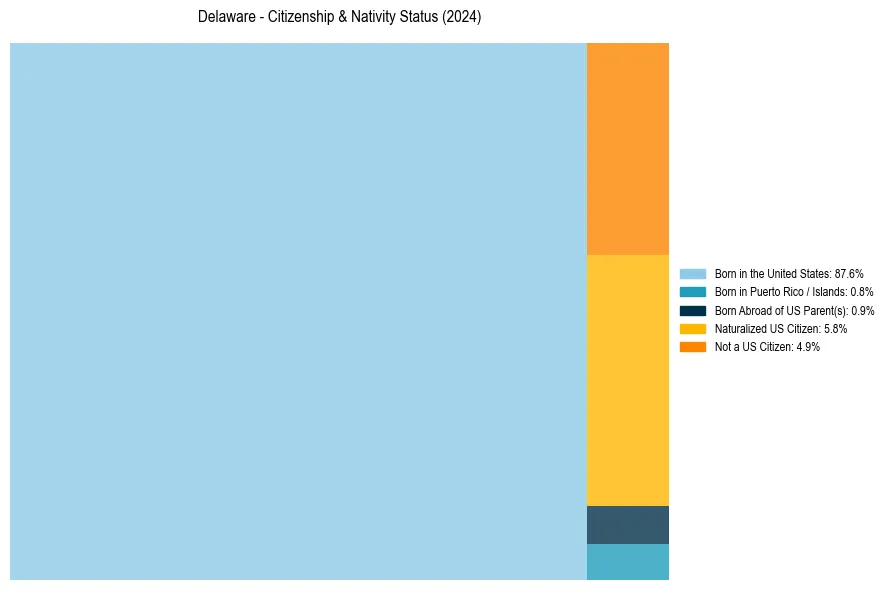
Delaware Nativity & Citizenship Indicators (2024)
Native Born
89.3%
Foreign Born
10.7%
Naturalized
5.8%
US Citizens
95.1%
Delaware Nativity & Citizenship Distribution
Delaware Historical Nativity Trends (2010–2024)
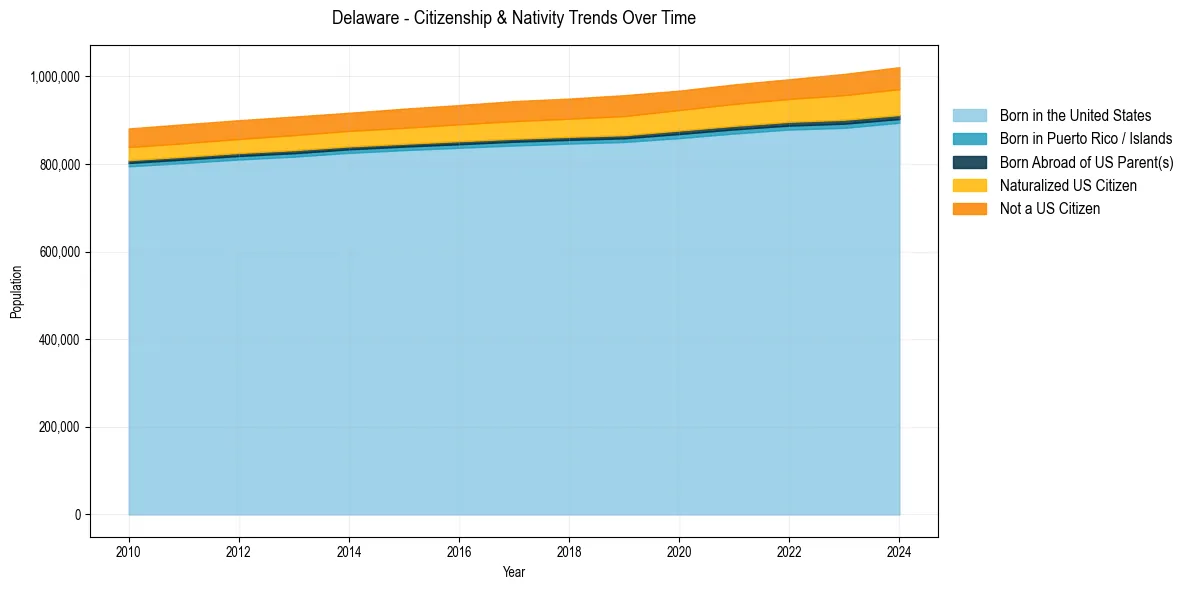
Delaware Population & Nativity History
| Year | Total Pop | Foreign Born | Native Born |
|---|---|---|---|
| 2024 | 1,021,191 | 10.7% | 89.3% |
| 2023 | 1,005,872 | 10.4% | 89.6% |
| 2022 | 993,635 | 9.8% | 90.2% |
| 2021 | 981,892 | 9.6% | 90.4% |
| 2020 | 967,679 | 9.4% | 90.6% |
| 2019 | 957,248 | 9.6% | 90.4% |
| 2018 | 949,495 | 9.2% | 90.8% |
| 2017 | 943,732 | 9.1% | 90.9% |
| 2016 | 934,695 | 8.8% | 91.2% |
| 2015 | 926,454 | 8.7% | 91.3% |
| 2014 | 917,060 | 8.4% | 91.6% |
| 2013 | 908,446 | 8.4% | 91.6% |
| 2012 | 900,131 | 8.3% | 91.7% |
| 2011 | 890,856 | 8.3% | 91.7% |
| 2010 | 881,278 | 8.2% | 91.8% |
Nativity & Citizenship FAQs for Delaware
Approximately 10.7% of residents in Delaware were born outside the United States.
The vast majority of residents, roughly 95.1%, are U.S. citizens (including both native-born and naturalized citizens).