Kent County, Delaware Nativity & Citizenship Status (2024)
Place of birth and citizenship status analysis for Kent County, Delaware
Kent County, Delaware Nativity & Citizenship Indicators (2024)
Native Born
92.6%
Foreign Born
7.4%
Naturalized
4.6%
US Citizens
97.2%
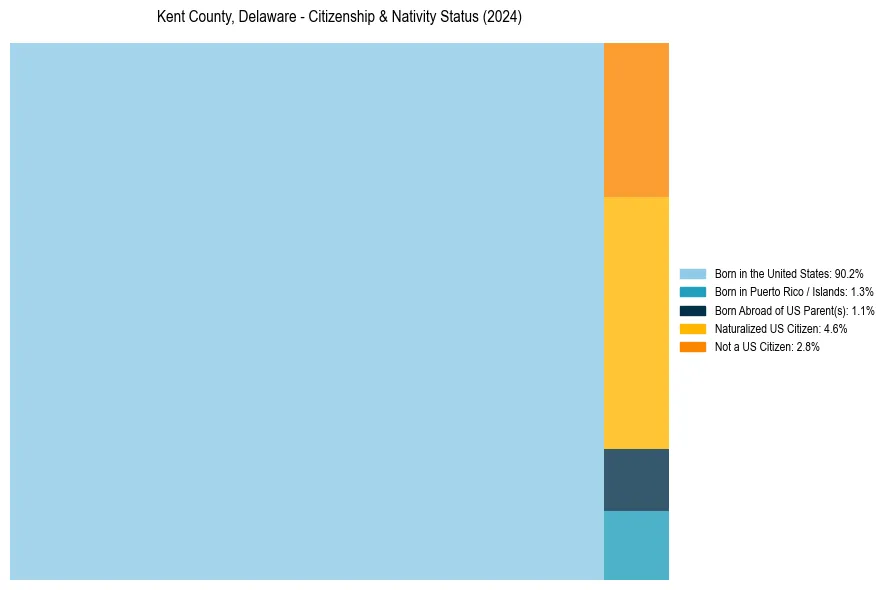
Kent County, Delaware Nativity & Citizenship Distribution
Kent County, Delaware Historical Nativity Trends (2010–2024)
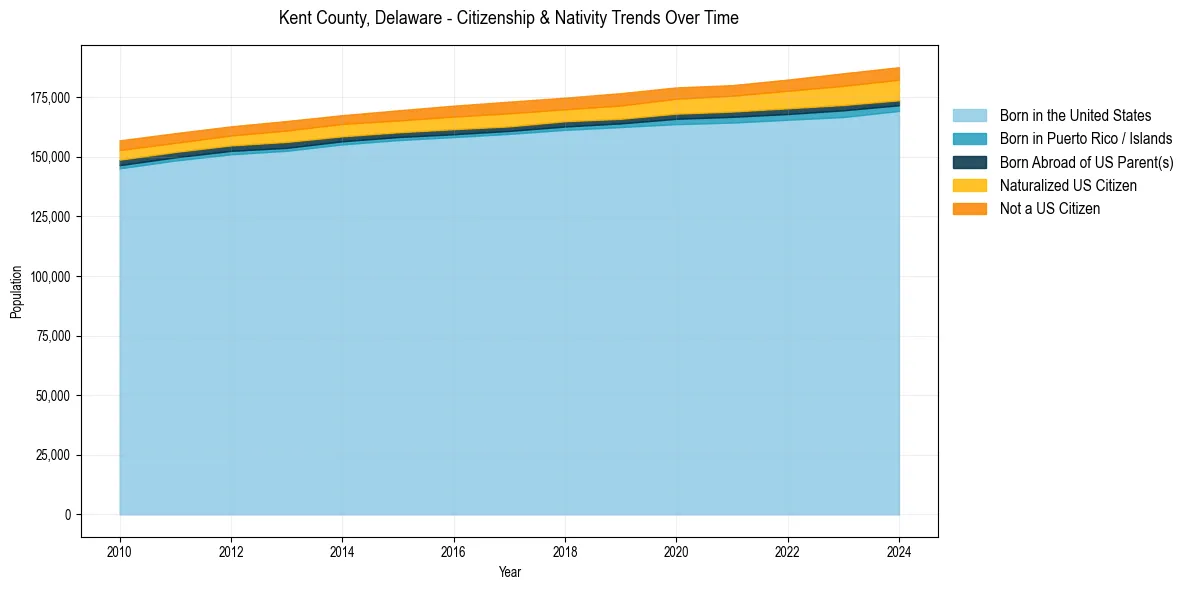
Kent County, Delaware Population & Nativity History
| Year | Total Pop | Foreign Born | Native Born |
|---|---|---|---|
| 2024 | 187,604 | 7.4% | 92.6% |
| 2023 | 185,043 | 7.2% | 92.8% |
| 2022 | 182,400 | 6.6% | 93.4% |
| 2021 | 180,078 | 6.2% | 93.8% |
| 2020 | 179,124 | 6.2% | 93.8% |
| 2019 | 176,699 | 6.1% | 93.9% |
| 2018 | 174,822 | 5.7% | 94.3% |
| 2017 | 173,145 | 6.0% | 94.0% |
| 2016 | 171,474 | 5.8% | 94.2% |
| 2015 | 169,509 | 5.4% | 94.6% |
| 2014 | 167,477 | 5.3% | 94.7% |
| 2013 | 165,030 | 5.3% | 94.7% |
| 2012 | 162,785 | 4.9% | 95.1% |
| 2011 | 159,936 | 4.9% | 95.1% |
| 2010 | 156,918 | 5.2% | 94.8% |
Nativity & Citizenship FAQs for Kent County, Delaware
Approximately 7.4% of residents in Kent County, Delaware were born outside the United States.
The vast majority of residents, roughly 97.2%, are U.S. citizens (including both native-born and naturalized citizens).