Connecticut Nativity & Citizenship Status (2024)
Place of birth and citizenship status analysis for Connecticut
Connecticut Nativity & Citizenship Indicators (2024)
Native Born
84.3%
Foreign Born
15.7%
Naturalized
8.7%
US Citizens
92.9%
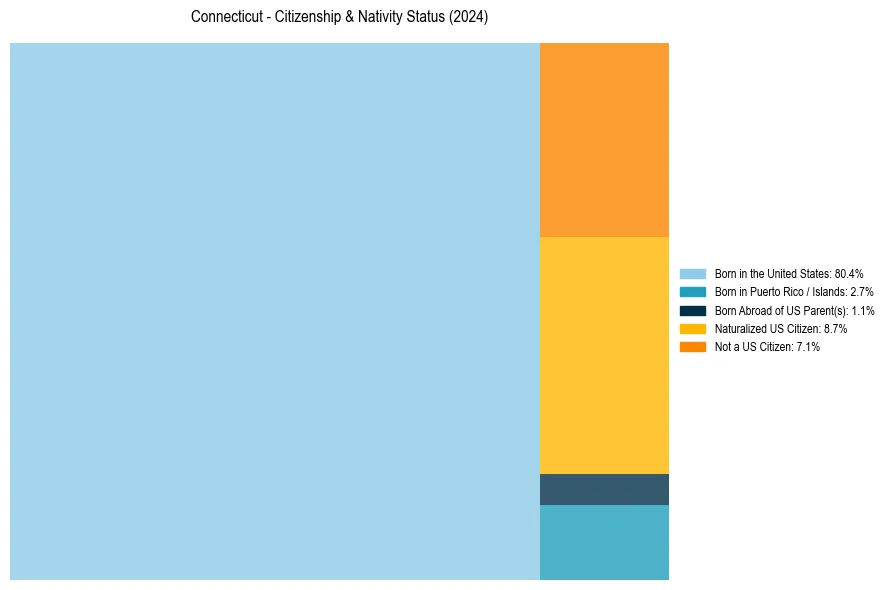
Connecticut Nativity & Citizenship Distribution
Connecticut Historical Nativity Trends (2010–2024)
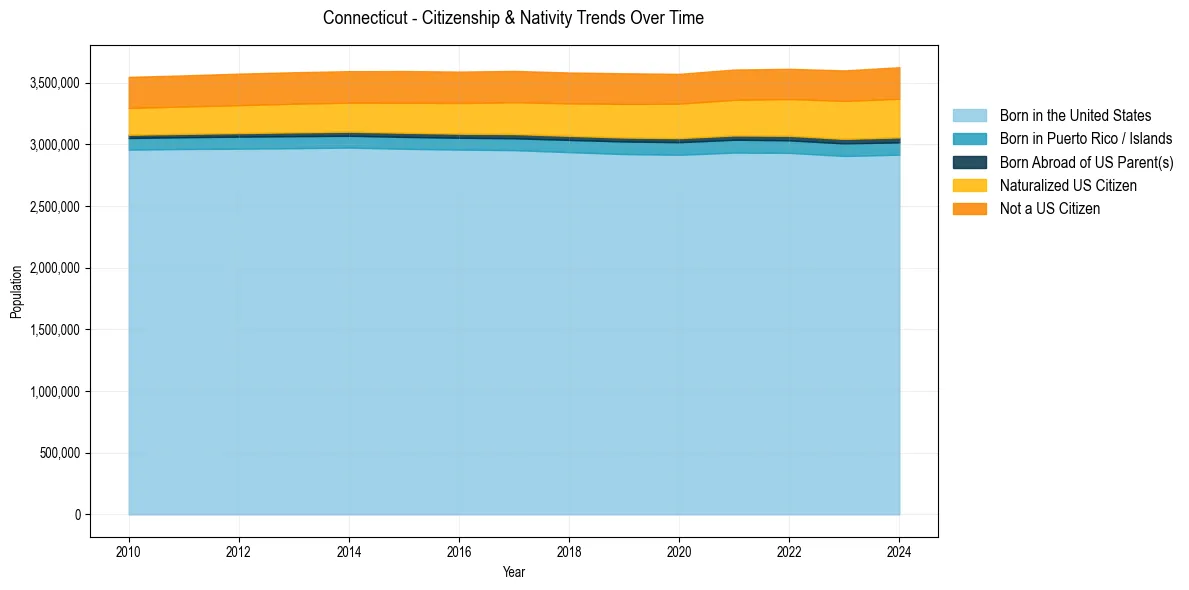
Connecticut Population & Nativity History
| Year | Total Pop | Foreign Born | Native Born |
|---|---|---|---|
| 2024 | 3,624,508 | 15.7% | 84.3% |
| 2023 | 3,598,348 | 15.4% | 84.6% |
| 2022 | 3,611,317 | 15.0% | 85.0% |
| 2021 | 3,605,330 | 14.8% | 85.2% |
| 2020 | 3,570,549 | 14.6% | 85.4% |
| 2019 | 3,575,074 | 14.6% | 85.4% |
| 2018 | 3,581,504 | 14.3% | 85.7% |
| 2017 | 3,594,478 | 14.2% | 85.8% |
| 2016 | 3,588,570 | 14.0% | 86.0% |
| 2015 | 3,593,222 | 13.9% | 86.1% |
| 2014 | 3,592,053 | 13.7% | 86.3% |
| 2013 | 3,583,561 | 13.6% | 86.4% |
| 2012 | 3,572,213 | 13.5% | 86.5% |
| 2011 | 3,558,172 | 13.3% | 86.7% |
| 2010 | 3,545,837 | 13.2% | 86.8% |
Nativity & Citizenship FAQs for Connecticut
Approximately 15.7% of residents in Connecticut were born outside the United States.
The vast majority of residents, roughly 92.9%, are U.S. citizens (including both native-born and naturalized citizens).