Lower Connecticut River Valley Planning Region, Connecticut Household Income Distribution (2024)
Household Income statistics for Lower Connecticut River Valley Planning Region, Connecticut
Lower Connecticut River Valley Planning Region, Connecticut Household Income Indicators (2024)
Median Income
$104,428
Total Households
74,068
High Earners ($150k+)
33.0%
Very Low (<$20k)
7.6%
Lower Connecticut River Valley Planning Region, Connecticut Household Income Distribution Chart
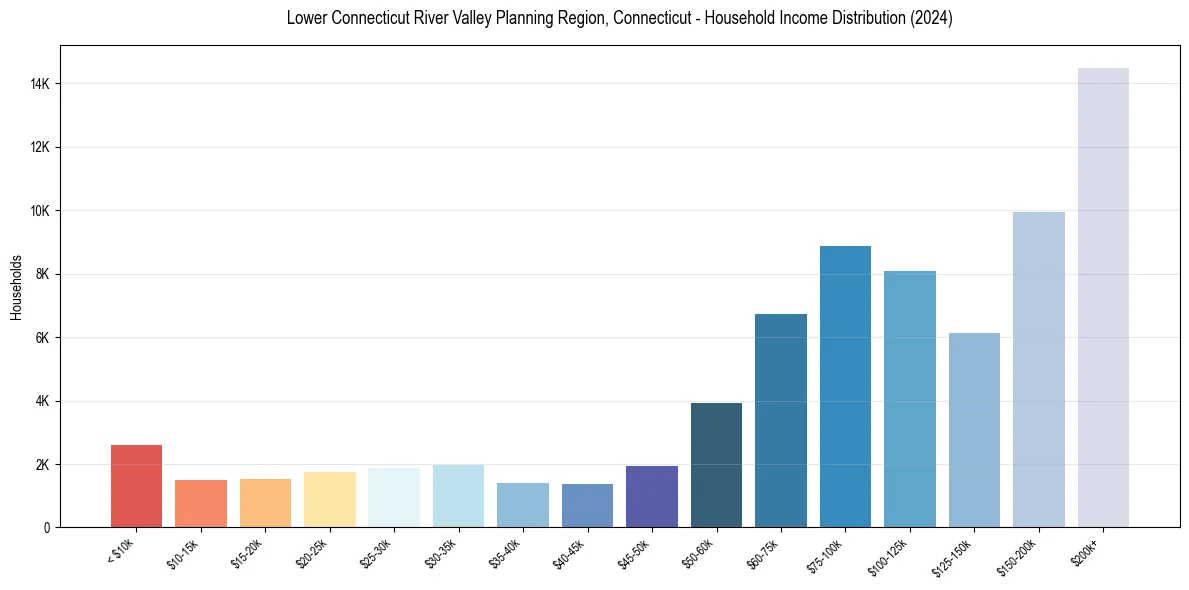
Lower Connecticut River Valley Planning Region, Connecticut Household Income Breakdown by Bracket
| Economic Class | Percentage |
|---|---|
| Very Low <$20k | 7.6% |
| Low $20k-34k | 7.6% |
| Lower Middle $35k-49k | 6.3% |
| Middle $50k-74k | 14.4% |
| Upper Middle $75k-149k | 31.1% |
| High $150k+ | 33.0% |
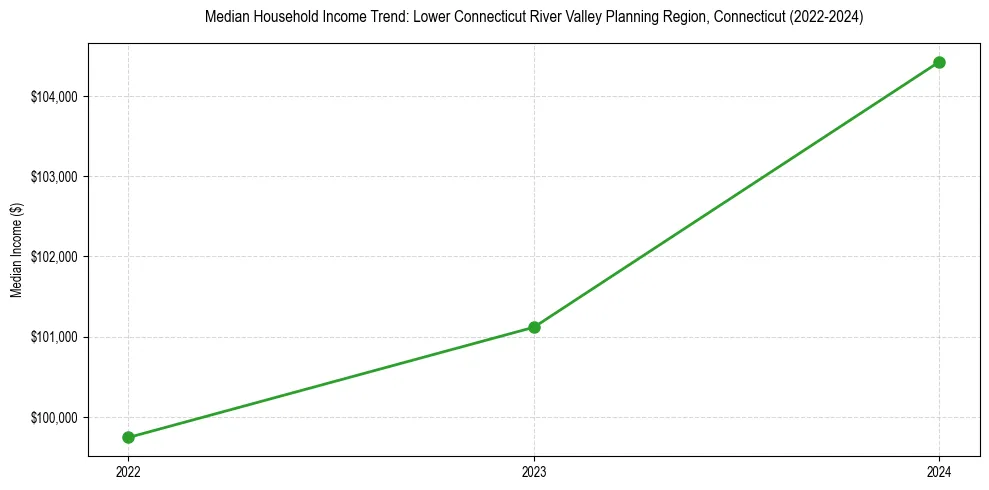
Lower Connecticut River Valley Planning Region, Connecticut Median Income Trend (2010–2024)
Household Income FAQs for Lower Connecticut River Valley Planning Region, Connecticut
The median household income in Lower Connecticut River Valley Planning Region, Connecticut is $104,428.
In recent years, the median household income in Lower Connecticut River Valley Planning Region, Connecticut has increased by 4.7%.