Connecticut Age & Gender Distribution (2024)
Population distribution by age and gender for Connecticut
Connecticut Age & Gender Statistics (2024)
Total Population
3,624,508
Median Age
41.1
Male Median
39.8
Female Median
42.5
Connecticut Population Growth
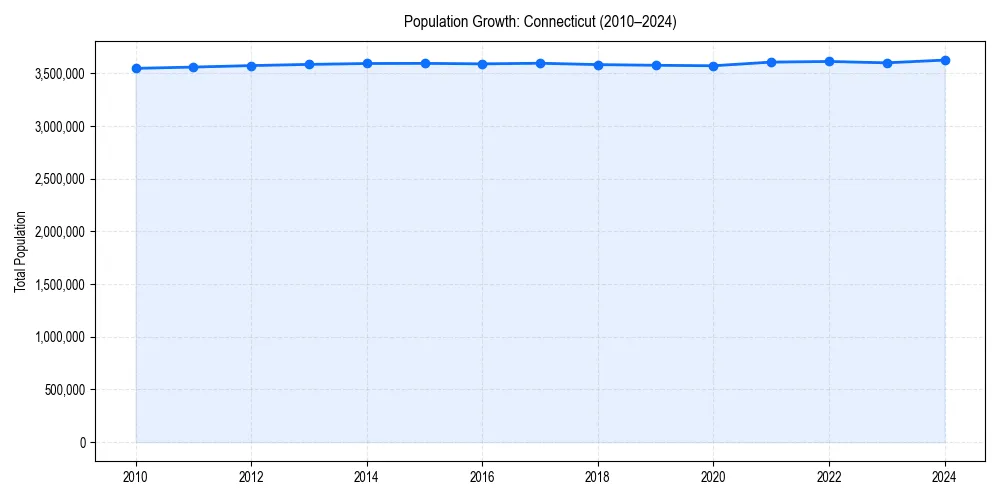
Connecticut Demographic Trend
Since 2010, the population of has changed by +2.2%%.
+2.2%% Growth
Connecticut Age & Gender Pyramid
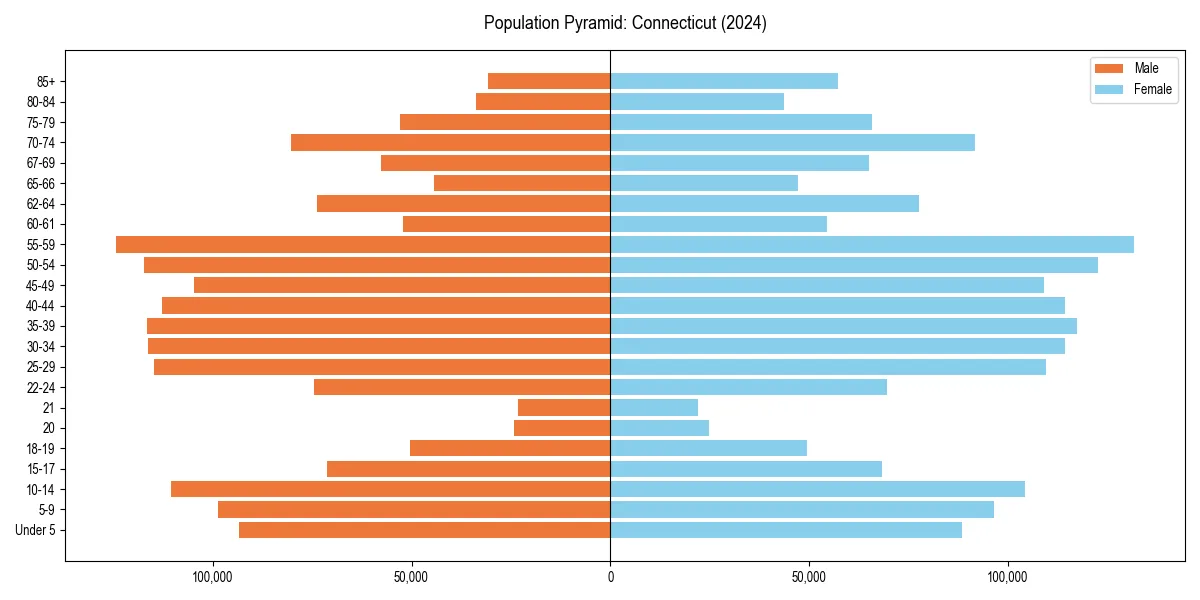
Figure 2: Population distribution by age and gender for 2024.
Connecticut Historical Population Data
| Year | Median Age | Population |
|---|---|---|
| 2024 | 41.1 | 3,624,508 |
| 2023 | 41.2 | 3,598,348 |
| 2022 | 40.9 | 3,611,317 |
| 2021 | 41.0 | 3,605,330 |
| 2020 | 41.1 | 3,570,549 |
| 2019 | 41.0 | 3,575,074 |
| 2018 | 40.8 | 3,581,504 |
| 2017 | 40.8 | 3,594,478 |
| 2016 | 40.6 | 3,588,570 |
| 2015 | 40.4 | 3,593,222 |
| 2014 | 40.3 | 3,592,053 |
| 2013 | 40.2 | 3,583,561 |
| 2012 | 40.0 | 3,572,213 |
| 2011 | 39.8 | 3,558,172 |
| 2010 | 39.5 | 3,545,837 |
Connecticut Age Group Breakdown (2024)
| Age Cohort | Percentage |
|---|---|
| Under 5 | 5.0% |
| 5–17 | 15.2% |
| 18–24 | 9.3% |
| 25–34 | 12.6% |
| 35–54 | 25.2% |
| 55–64 | 14.2% |
| 65+ | 18.5% |
Dependency Ratios for Connecticut
- Total Dependency Ratio:
- 63.1
- Youth Dependency:
- 32.9
- Old-Age Dependency:
- 30.2
The dependency ratio measures dependents (ages 0-17 and 65+) per 100 working-age individuals (ages 18-64).
Age & Gender FAQs for Connecticut
The median age in Connecticut is 41.1 years.
According to latest Census data, the total population of Connecticut is 3,624,508.
In Connecticut, seniors (ages 65+) make up 18.5% of the population, while children under 18 represent 15.2%.
Based on historical data since 2010, the population in Connecticut is aging.