Weld County, Colorado Nativity & Citizenship Status (2024)
Place of birth and citizenship status analysis for Weld County, Colorado
Weld County, Colorado Nativity & Citizenship Indicators (2024)
Native Born
90.9%
Foreign Born
9.1%
Naturalized
3.9%
US Citizens
94.8%
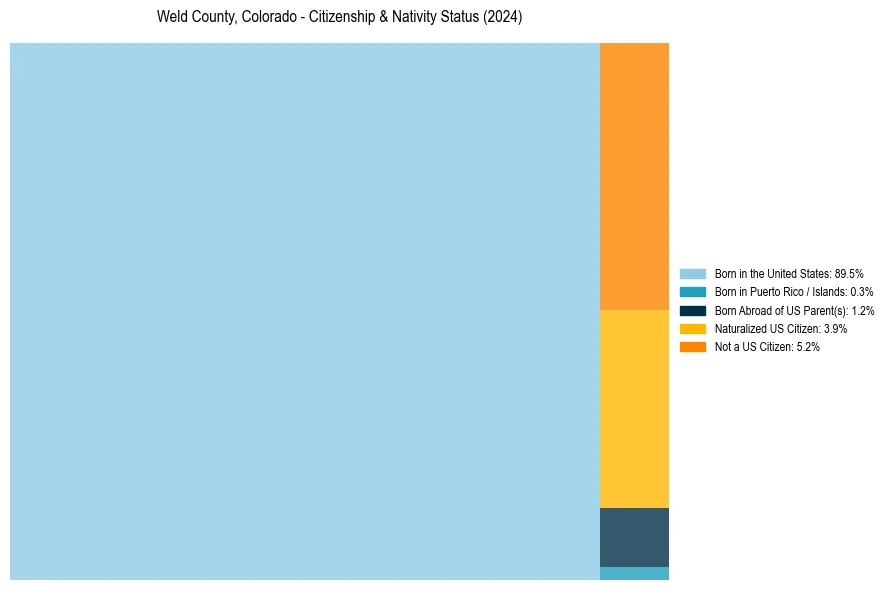
Weld County, Colorado Nativity & Citizenship Distribution
Weld County, Colorado Historical Nativity Trends (2010–2024)
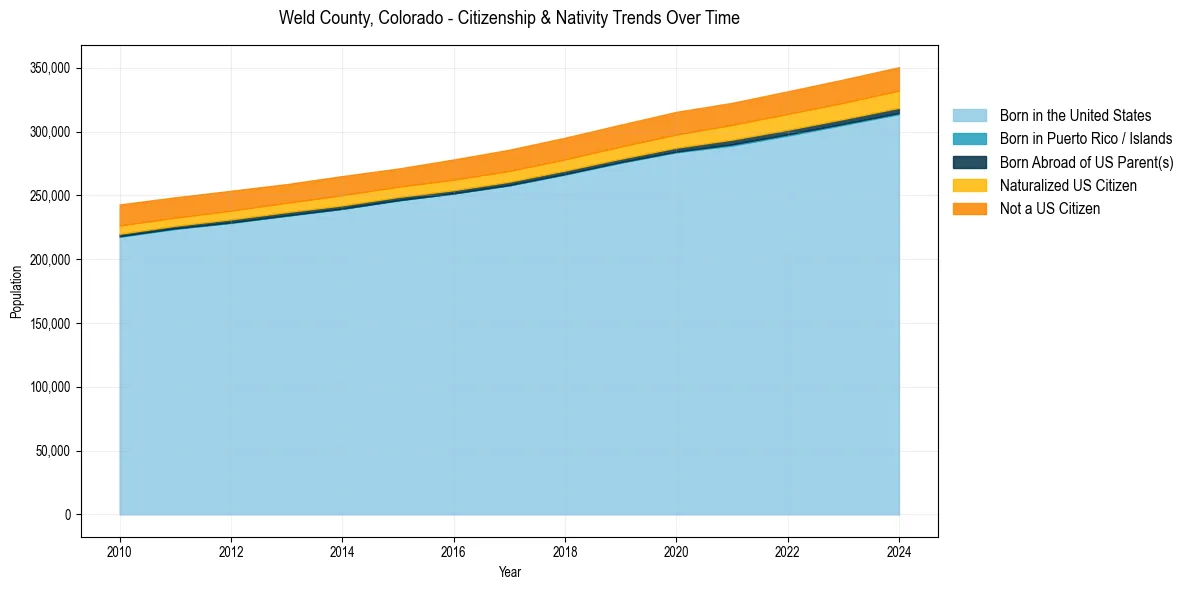
Weld County, Colorado Population & Nativity History
| Year | Total Pop | Foreign Born | Native Born |
|---|---|---|---|
| 2024 | 350,396 | 9.1% | 90.9% |
| 2023 | 340,711 | 9.1% | 90.9% |
| 2022 | 331,466 | 9.1% | 90.9% |
| 2021 | 322,424 | 8.9% | 91.1% |
| 2020 | 315,389 | 8.9% | 91.1% |
| 2019 | 305,345 | 8.7% | 91.3% |
| 2018 | 295,123 | 8.7% | 91.3% |
| 2017 | 285,729 | 8.8% | 91.2% |
| 2016 | 278,065 | 8.7% | 91.3% |
| 2015 | 270,948 | 8.2% | 91.8% |
| 2014 | 265,066 | 8.7% | 91.3% |
| 2013 | 258,780 | 8.5% | 91.5% |
| 2012 | 253,552 | 8.8% | 91.2% |
| 2011 | 248,441 | 9.0% | 91.0% |
| 2010 | 242,860 | 9.5% | 90.5% |
Nativity & Citizenship FAQs for Weld County, Colorado
Approximately 9.1% of residents in Weld County, Colorado were born outside the United States.
The vast majority of residents, roughly 94.8%, are U.S. citizens (including both native-born and naturalized citizens).