Phillips County, Colorado Nativity & Citizenship Status (2024)
Place of birth and citizenship status analysis for Phillips County, Colorado
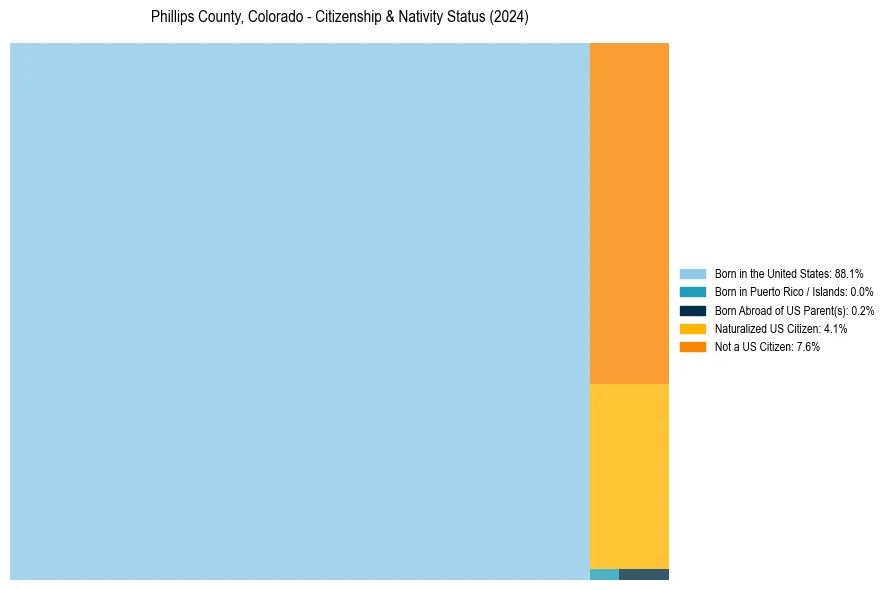
Phillips County, Colorado Nativity & Citizenship Indicators (2024)
Native Born
88.3%
Foreign Born
11.7%
Naturalized
4.1%
US Citizens
92.4%
Phillips County, Colorado Nativity & Citizenship Distribution
Phillips County, Colorado Historical Nativity Trends (2010–2024)
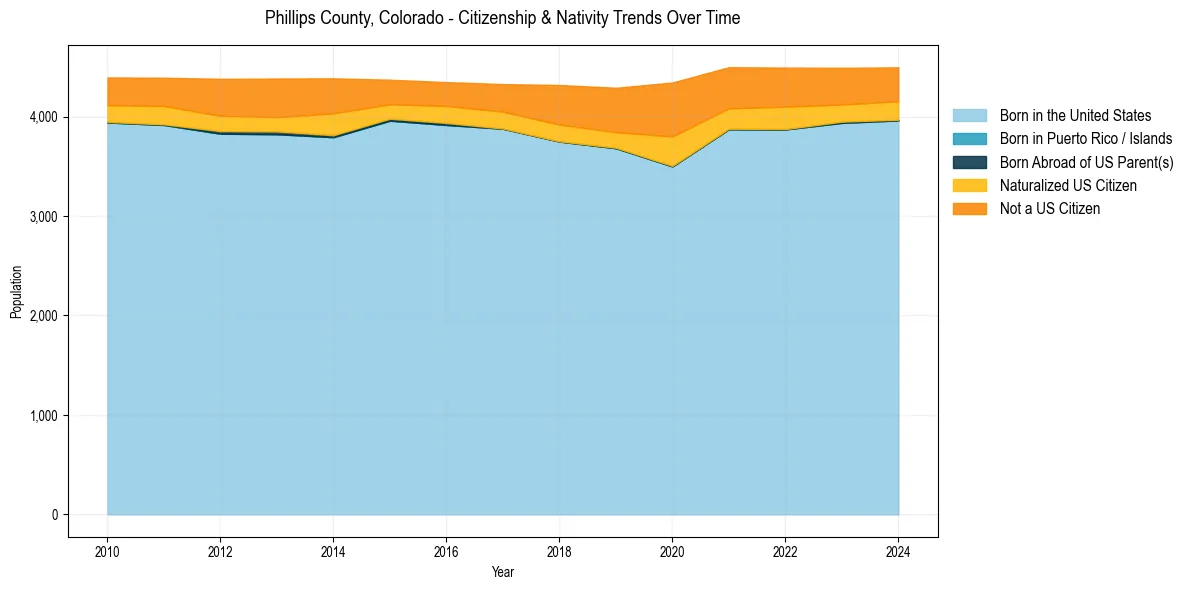
Phillips County, Colorado Population & Nativity History
| Year | Total Pop | Foreign Born | Native Born |
|---|---|---|---|
| 2024 | 4,496 | 11.7% | 88.3% |
| 2023 | 4,491 | 12.1% | 87.9% |
| 2022 | 4,493 | 13.8% | 86.2% |
| 2021 | 4,497 | 13.8% | 86.2% |
| 2020 | 4,343 | 19.3% | 80.7% |
| 2019 | 4,290 | 14.1% | 85.9% |
| 2018 | 4,318 | 13.1% | 86.9% |
| 2017 | 4,327 | 10.3% | 89.7% |
| 2016 | 4,347 | 9.5% | 90.5% |
| 2015 | 4,371 | 9.0% | 91.0% |
| 2014 | 4,385 | 13.0% | 87.0% |
| 2013 | 4,383 | 12.2% | 87.8% |
| 2012 | 4,380 | 12.0% | 88.0% |
| 2011 | 4,391 | 10.7% | 89.3% |
| 2010 | 4,394 | 10.2% | 89.8% |
Nativity & Citizenship FAQs for Phillips County, Colorado
Approximately 11.7% of residents in Phillips County, Colorado were born outside the United States.
The vast majority of residents, roughly 92.4%, are U.S. citizens (including both native-born and naturalized citizens).