Colorado Nativity & Citizenship Status (2024)
Place of birth and citizenship status analysis for Colorado
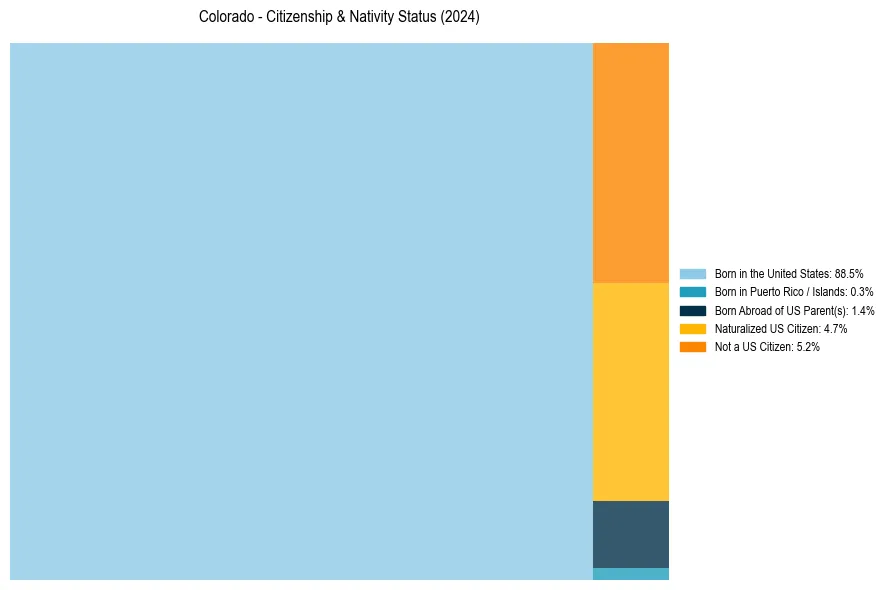
Colorado Nativity & Citizenship Indicators (2024)
Native Born
90.2%
Foreign Born
9.8%
Naturalized
4.7%
US Citizens
94.8%
Colorado Nativity & Citizenship Distribution
Colorado Historical Nativity Trends (2010–2024)
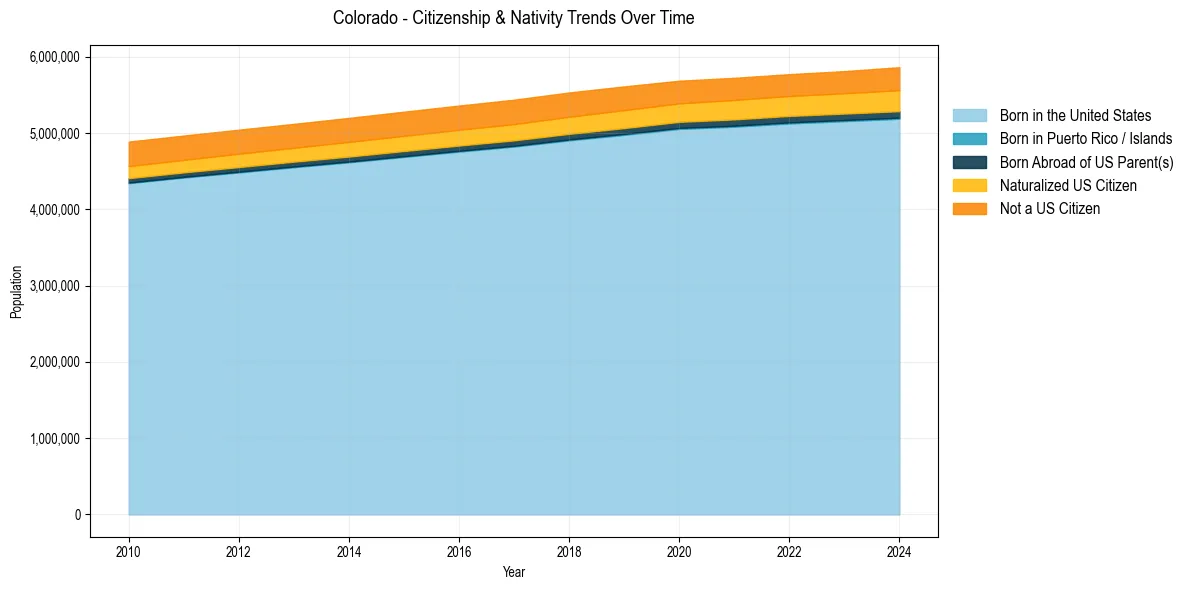
Colorado Population & Nativity History
| Year | Total Pop | Foreign Born | Native Born |
|---|---|---|---|
| 2024 | 5,862,189 | 9.8% | 90.2% |
| 2023 | 5,810,774 | 9.6% | 90.4% |
| 2022 | 5,770,790 | 9.5% | 90.5% |
| 2021 | 5,723,176 | 9.5% | 90.5% |
| 2020 | 5,684,926 | 9.5% | 90.5% |
| 2019 | 5,610,349 | 9.7% | 90.3% |
| 2018 | 5,531,141 | 9.8% | 90.2% |
| 2017 | 5,436,519 | 9.8% | 90.2% |
| 2016 | 5,359,295 | 9.8% | 90.2% |
| 2015 | 5,278,906 | 9.8% | 90.2% |
| 2014 | 5,197,580 | 9.8% | 90.2% |
| 2013 | 5,119,329 | 9.7% | 90.3% |
| 2012 | 5,042,853 | 9.7% | 90.3% |
| 2011 | 4,966,061 | 9.7% | 90.3% |
| 2010 | 4,887,061 | 9.8% | 90.2% |
Nativity & Citizenship FAQs for Colorado
Approximately 9.8% of residents in Colorado were born outside the United States.
The vast majority of residents, roughly 94.8%, are U.S. citizens (including both native-born and naturalized citizens).