Larimer County, Colorado Nativity & Citizenship Status (2024)
Place of birth and citizenship status analysis for Larimer County, Colorado
Larimer County, Colorado Nativity & Citizenship Indicators (2024)
Native Born
94.5%
Foreign Born
5.5%
Naturalized
2.9%
US Citizens
97.4%
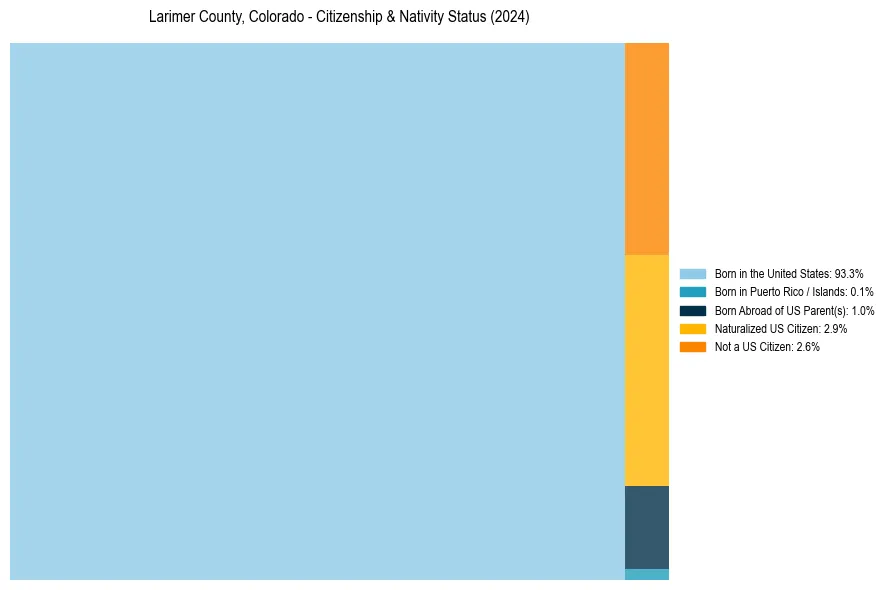
Larimer County, Colorado Nativity & Citizenship Distribution
Larimer County, Colorado Historical Nativity Trends (2010–2024)
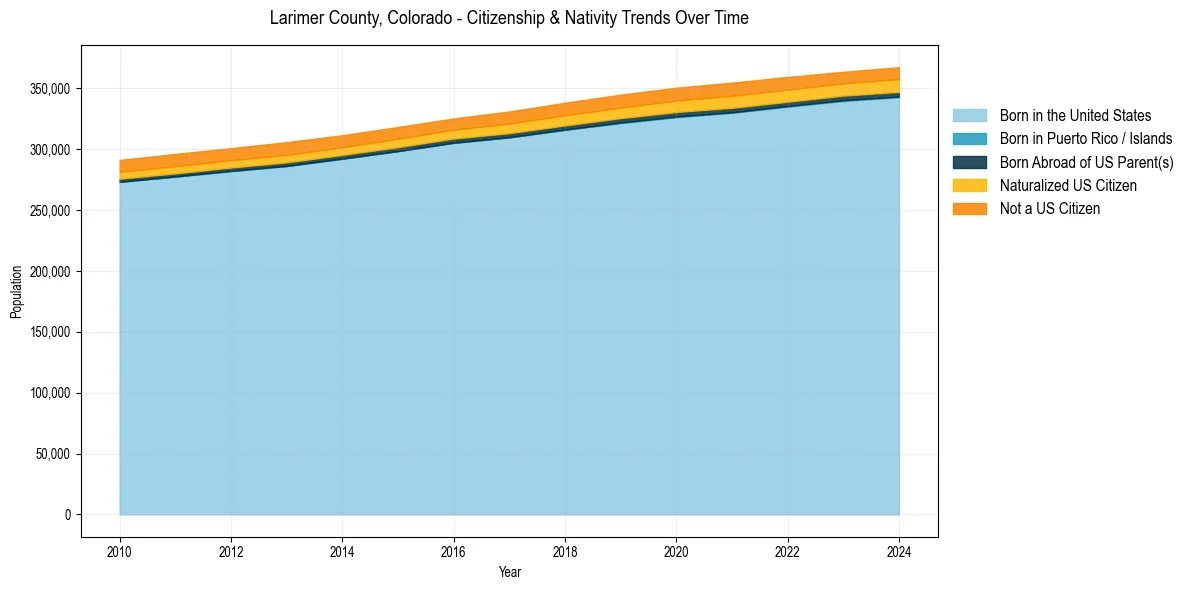
Larimer County, Colorado Population & Nativity History
| Year | Total Pop | Foreign Born | Native Born |
|---|---|---|---|
| 2024 | 367,368 | 5.5% | 94.5% |
| 2023 | 363,561 | 5.4% | 94.6% |
| 2022 | 359,363 | 5.7% | 94.3% |
| 2021 | 354,670 | 5.8% | 94.2% |
| 2020 | 350,523 | 5.7% | 94.3% |
| 2019 | 344,786 | 5.6% | 94.4% |
| 2018 | 338,161 | 5.5% | 94.5% |
| 2017 | 330,976 | 5.4% | 94.6% |
| 2016 | 325,228 | 5.1% | 94.9% |
| 2015 | 318,227 | 5.2% | 94.8% |
| 2014 | 311,435 | 5.2% | 94.8% |
| 2013 | 305,798 | 5.4% | 94.6% |
| 2012 | 300,870 | 5.3% | 94.7% |
| 2011 | 296,107 | 5.4% | 94.6% |
| 2010 | 291,162 | 5.3% | 94.7% |
Nativity & Citizenship FAQs for Larimer County, Colorado
Approximately 5.5% of residents in Larimer County, Colorado were born outside the United States.
The vast majority of residents, roughly 97.4%, are U.S. citizens (including both native-born and naturalized citizens).